Forex Report
Report section of the backtest provides detailed reports regarding your backtests. The Forex Report gives you all the information you need to know your strategy from bottom to the top
Meta Report
The Meta Report table includes numeric performance metrics used by Meta Trader to evaluate a strategy. These metrics are:
Total Net Profit: The profit that the strategy made in the backtest period reported in $ unit
Gross Profit: The sum of all the profits the strategy made during the backtest period reported in $ unit
Gross Loss: The sum of all the losses the strategy made during the backtest period reported in $ unit
Profit Factor: The ratio of the total gross profit to the total gross loss of a strategy
Expected Payoff: Represents the average gain or loss that you can expect to make on a trade over a large number of trades
Absolute Drawdown: Shows drawdown with respect to the initial balance during the backtest report
Maximum Drawdown: Shows largest drop from a previous peak during the backtest period
Total Trade: Total number of trades that the strategy made
Long Positions (won %): Total number of long positions the strategy made; the win rate of the strategy for long positions is reported inside parenthesis
Short Positions (won %): Total number of short positions the strategy made; the win rate of the strategy for short positions is reported inside parenthesis
Positions Closed in Profit: Total number of positions that the strategy closed in profit; the win rate of the strategy is reported inside the parenthesis
Positions Closed in Loss: Total number of positions that the strategy closed in loss; the win rate of the strategy is reported inside the parenthesis
Largest Profit: The largest profit the strategy made
Largest Loss: The largest loss the strategy made
Average Profit: The average profit the strategy makes when it wins, reported in percent
Average Loss: The average loss the strategy makes when it loses, reported in percent
Maximum Consecutive Wins: The maximum number of positions closed in profit sequentially
Maximum Consecutive Losses: The maximum number of positions closed in profit sequentially
Average Consecutive Wins: The average number of positions closed in loss sequentially
Average Consecutive Losses: The average number of positions closed in loss sequentially
Performance Report
The Performance Report table contains the most valuable metrics for evaluating a strategy. These metrics are:
Profit: The profit the strategy makes in the backtest period reported in percent
Backtest Time: The period that the backtest is tested with
Number of Backtest Days: The number of days within the Backtest Time
Time in the Market: The amount of time that the strategy has open positions during the backtest period reported as the percentage of total backtest time
Number of Trades: Total number of trades the strategy makes during the backtest period
Win Rate: The percentage of the positions the strategy closes in profit
Profit to Loss Ratio: The ratio of the net profit to the net loss of a strategy; same as Profit Factor
Market Change: The change in the value of the market during the backtest period reported in percent
Sharpe Ratio: The ratio of extra profit gained by the strategy compared with a risk-free investment to the volatility of the strategy; to read more about the Sharpe ratio, read here
Calmar Ratio: The ratio of extra profit gained by the strategy compared with a risk-free investment to the maximum drawdown of the strategy; to read more about the Sharpe ratio, read here
Max Drawdown (%): The maximum observed loss from a peak to a trough of a portfolio, before a new peak is attained
**Best Trade Profit(
unit **Worst Trade Profit (
unit Average Duration: The average time that the strategy leaves a position open
Daily Performance Metrics Report
This table provides performance metrics calculated from daily returns of the strategy. These metrics are:
Sharpe Ratio: The ratio of extra profit gained by the strategy compared with a risk-free investment to the volatility of the strategy; to read more about the Sharpe ratio, read here
Sortino Ratio: Measures the strategy return relative to downside risk only; to read more the Sortino ratio, read here
Omega Ratio: Measures the ratio of the probability of positive returns to the probability of negative returns for all potential returns above a minimum acceptable return threshold; to read more the Omega ratio, read here
Calmar Ratio: Measures investment return relative to its maximum drawdown; to read more about the Sharpe ratio, read here
Tail Ratio: Measures the ratio of the magnitude of best gains to the magnitude of worst losses. To read more about this metric, read here
Stability: Measures the robustness of a strategy ranging from zero to one; higher values indicate more robustness. To read more about the Stability, read here
Annual Volatility (%): Measures how much the worth of strategy holdings fluctuates over one year; it's expressed as a percentage and is often used as a proxy for risk.
Max Drawdown (%): The largest peak-to-trough decline of the strategy holdings over a specific period; it measures the potential loss an investor could have suffered. QuantiX uses daily returns to measure Max Drawdown
Skew: Measures the asymmetry of the probability distribution of returns; it indicates the likelihood of extreme price movements, particularly on the downside. A positive skew suggests more large positive returns, while a negative skew indicates more large negative returns.
Kurtosis: Measures the "tailedness" of daily returns distribution; it indicates the likelihood of extreme values (outliers). A high kurtosis suggests more frequent extreme events, while a low kurtosis suggests fewer extreme events compared to a normal distribution.
Daily Value at Risk (%): Estimates the maximum potential loss of the strategy over a single day, given a specific confidence level (QuantiX uses 95% as its confidence leve); it helps assess the risk of sudden fluctuations. To read more about the Daily Value at Risk, read here
Annual Return: The profit or loss expected on the strategy over one year, expressed as a percentage of the initial money; when the backtest period is shorter than one year, we annualize the result.
Rolling Volatility
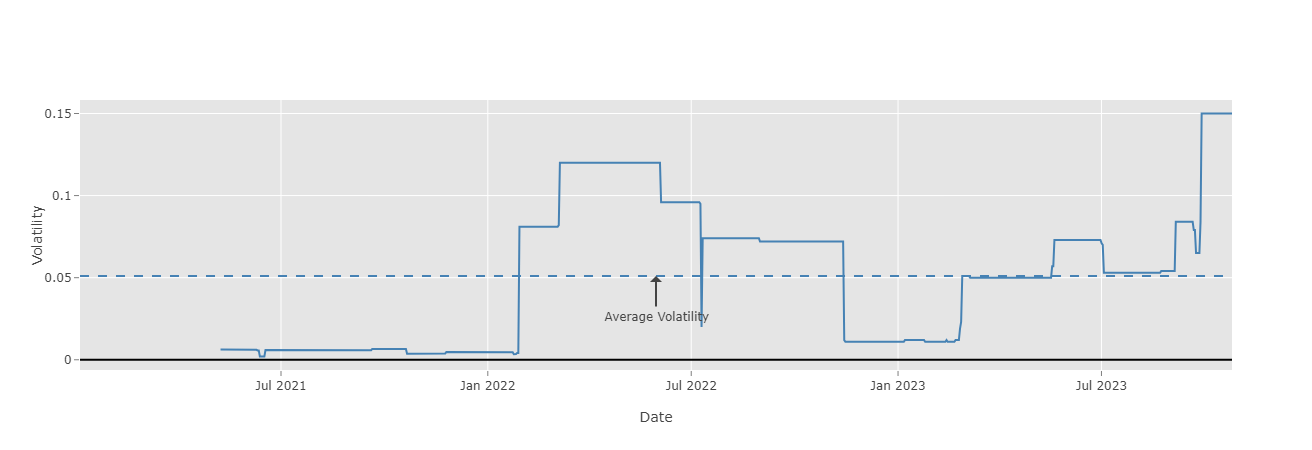
Rolling volatility is the volatility of the bot's holdings over a six-month period calculated for each data point using the daily returns of the last six months expressed as a percentage of the strategy's fund. Rolling volatility data is not available for the first six months of the backtest because there isn't sufficient data for calculations. The annual volatility of the strategy is also shown in the chart using a dotted line.
Rolling Return
Rolling return is the strategy's return over a six-month period calculated for each data point using the daily returns of the last six months expressed as a percentage of the strategy's fund. Rolling return data is not available for the first six months of the backtest because there isn't sufficient data for calculations.

Monthly Returns Heatmap
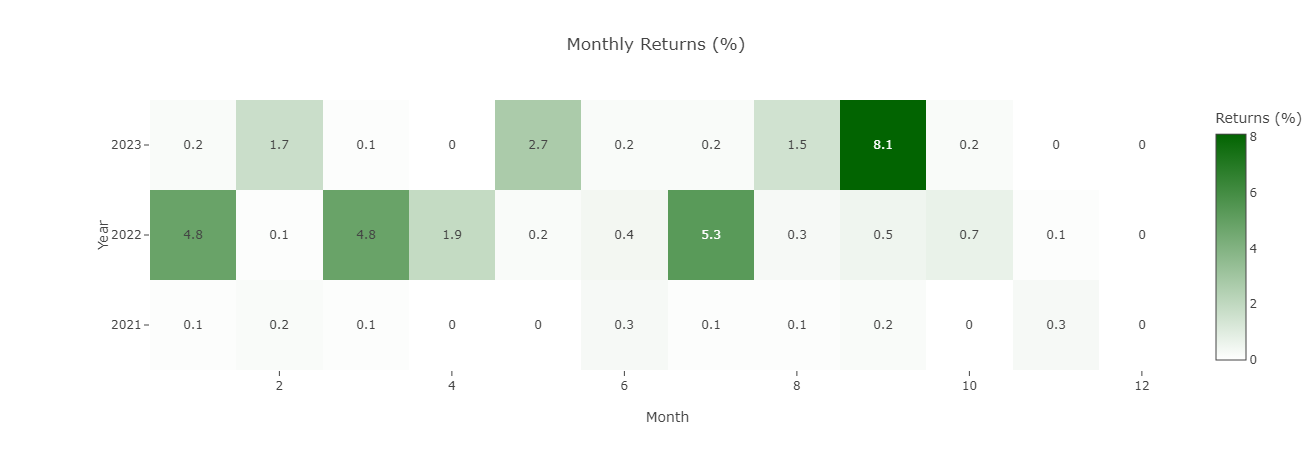
Monthy returns chart shows the return of the strategy in each month during the backtest period.
Rolling Sharpe Ratio
Rolling Sharpe ratio is the Sharpe ratio of the bot's holdings over a six-month period calculated for each data point using the daily returns of the last six months. Rolling Sharpe ratio data is not available for the first six months of the backtest because there isn't sufficient data for calculations. The overall Sharpe ratio of the strategy is also shown in the chart using a dotted line.

Returns
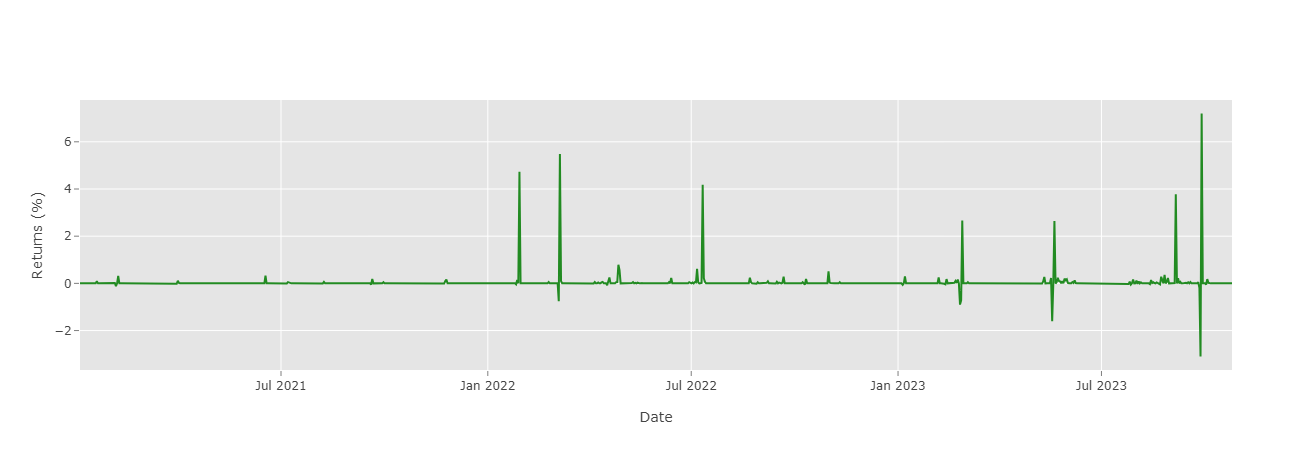
This report shows the returns of the strategy positions during the backtest period as a percentage of the strategy holdings.
Monthly Returns Distribution
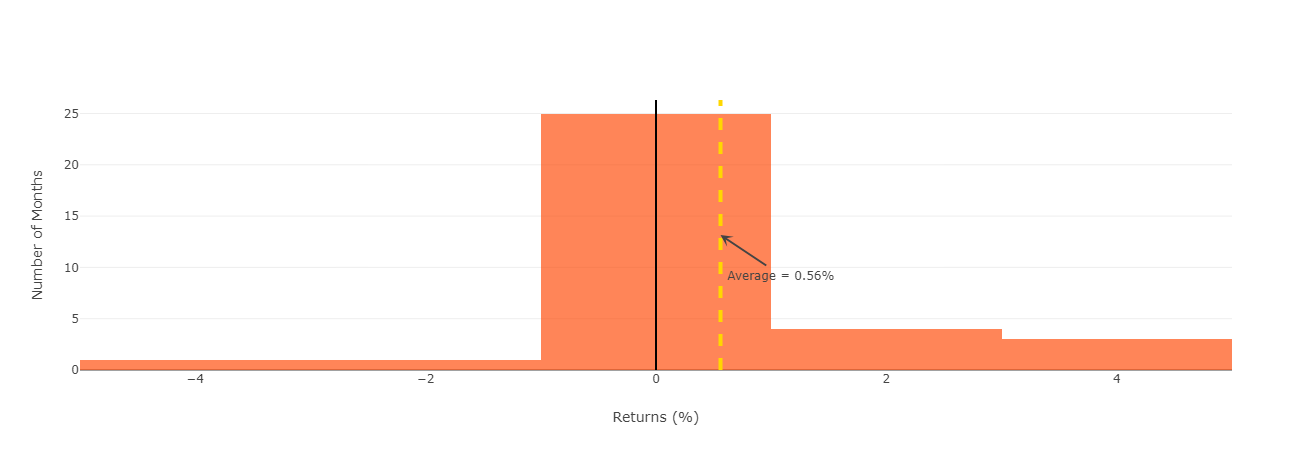
This chart shows the distribution of monthly returns. In other words, it shows the number of months that the return of the strategy was within specific ranges.
Drawdown Underwater
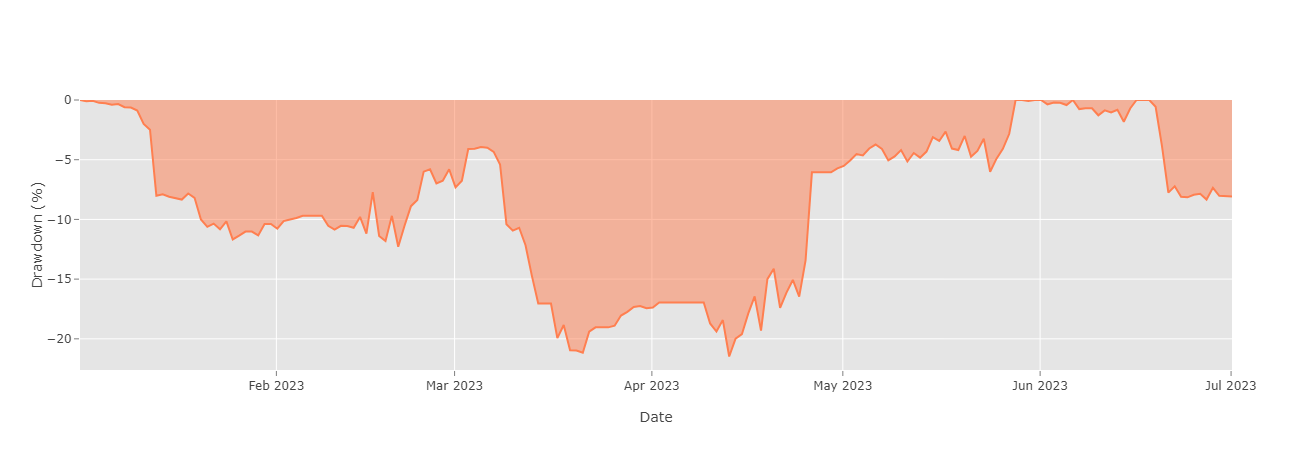
The Drawdown Underwater chart shows the strategy drawdonws during the backtest period. In other words, it shows how much the strategy fund drops from its previous peak during the backtest period.
Drawdown Periods
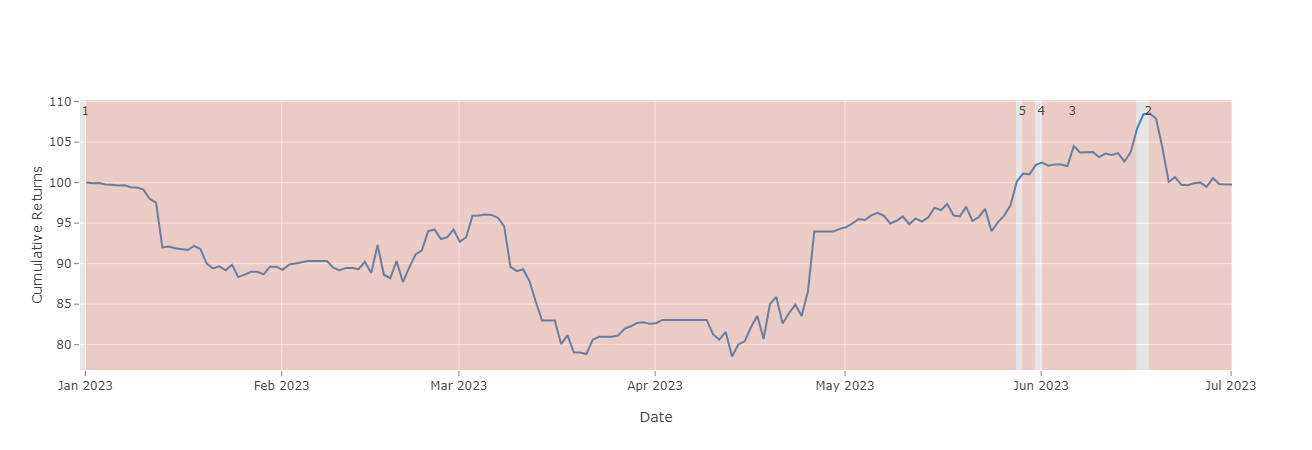
This chart shows five most significant drawdown periods in the backtest highlighting the five prominent time periods the strategy balance is significatly lower than its previous peak.
Returns Distribution
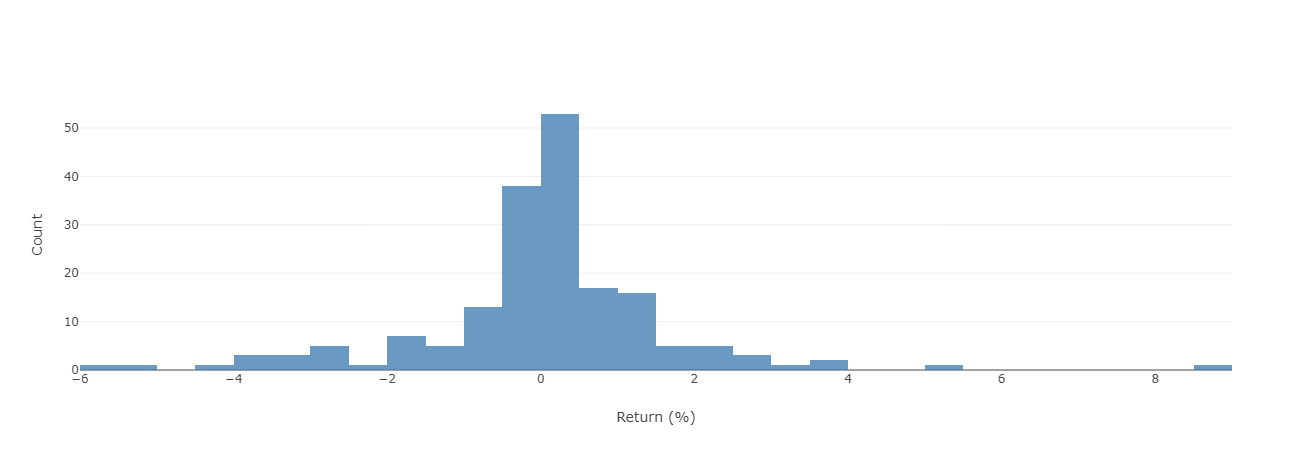
Return distribution shows the histogram of bot positions. On the X-axis, there are returns in percent and on the Y-axis, there are the number of positions. This chart shows the number of positions the strategy has in different intervals of returns.
Cumulative Returns
The Cumulative Returns graph shows the compound profit of the strategy during the backtest period. The compound profit is gained when the strategy uses the initial money and the profits it makes to trade.

Equity Plot
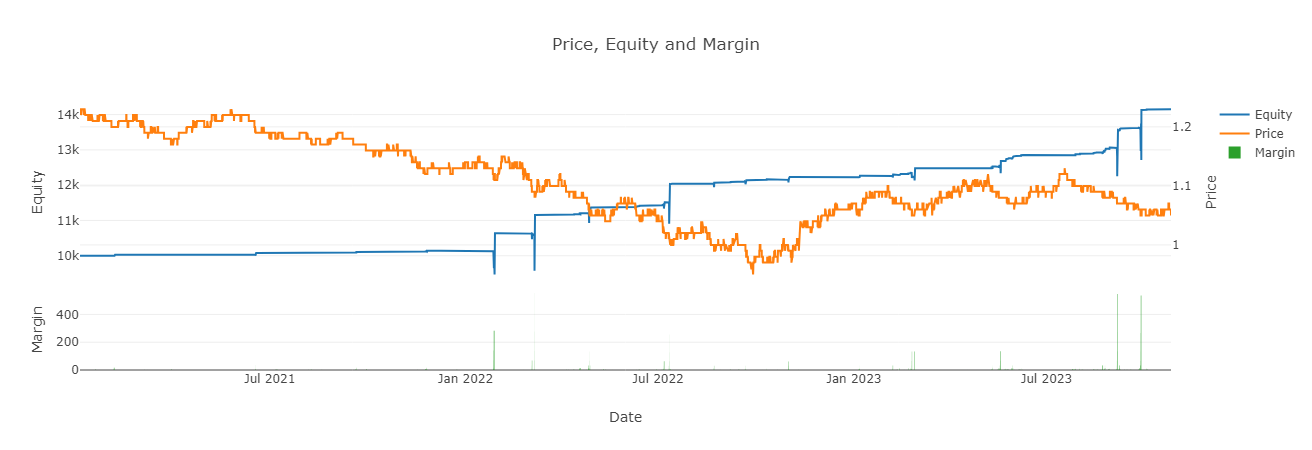
The Equity Plot shows the equity and margin of the strategy during the backtest in $. The horizontal axis of the graph is the data, the vertical axis on the left side of the graph is the equity, and the right side vertical axis is the price. Note that if you want to see the price graph, you need to activate it by clicking on the price in the graph legend. The price helps you better understand the change of equity and margin in different market regimes.
Cumulative Returns on Logarithmic Scale
This graph shows the logarithm of compound profit of the strategy during the backtest period. The compound profit is gained when the strategy uses the initial money and the profits it makes to trade.

Cumulative Returns Volatility Matched to Benchmark
???????????????????????????????
Balance Plot
This plot shows the account balance in $ and the size of open positions using lot as unit. Note: The horizontal axis of this graph is the number of positions

Categorize Report
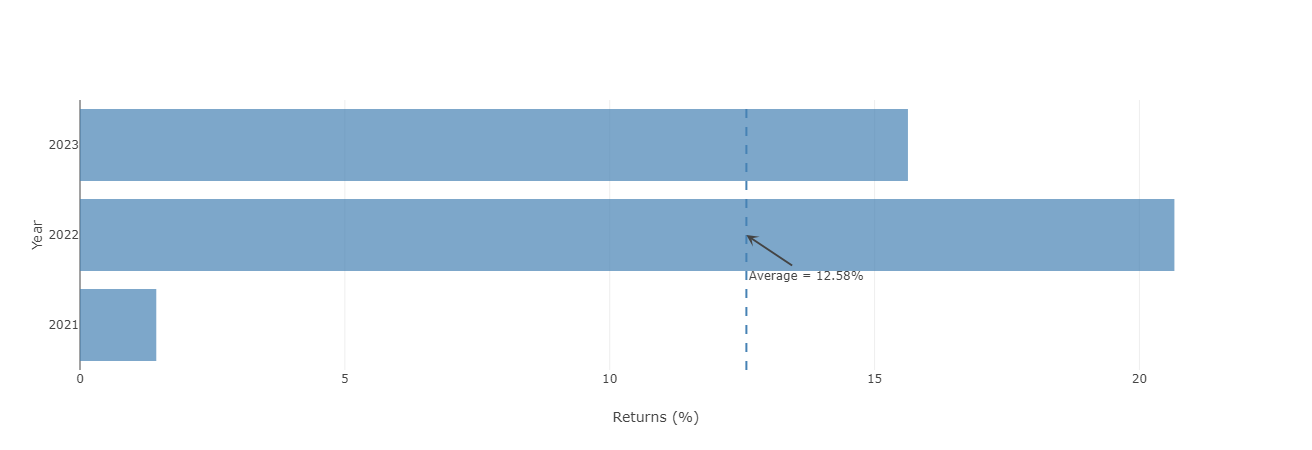
Annual Returns
The Annual Returns shows the annual return of the strategy for each year separately. It also reports the average annual return of the strategy during the backtest period.
Trading Positions Summary Report
This report gives you a summary of all the positions the strategy takes during the backtest period. It has three main sections:
Total Trades: Includes all positions of the strategy
Long Trades: Includes only long positions of the strategy
Short Trades: Includes only short positions of the strategy
Each of these three sections has three parts:
Total: The overall performance of the section
Win: The performance of positions closed in profit
Loss: The performance of positions closed in loss
The Total part in each section reports the following metrics:
: The total profit of the strategy reported in $. Worst Profit: The worst loss the strategy makes during the backtest period
Number of Positions: The total number of positions the strategy opens during the backtest period
Last Position Date: The opening date of the last position
Average Duration: The average time a position lasts
Max Duration: The longest time a position took during the backtest period to close
Average Profit ($): The average profit made by each position in the backtest period
Best Profit ($): The largest profit the strategy made by a single position
First Position date: The opening date of the first position
Duration of Trades: The overall time all positions took
Min Duration: The shortest time a position took during the backtest period
The Win part in each section reports the following metrics:
: The total profit of the strategy reported in $. Average Profit($): The average profit made by profitable position in the backtest period
Number of Positions: The total number of positions the strategy opens during the backtest period and closes in profit
Duration of Trades: The overall time all positions with profit took
Average Duration: The average time a position with profit lasts
Max Sequence: The maximum number of consecutive profitable positions
The Loss part in each section reports the following metrics:
: The total loss of the strategy reported in $. Average Loss($): The average loss made by positions lost in the backtest period
Number of Positions: The total number of positions the strategy opens during the backtest period and closes in loss
Duration of Trades: The overall time all positions with loss took
Average Duration: The average time a position with loss lasts
Max Sequence: The maximum number of consecutive positions with loss
Positions Table
This table shows details of all positions during the backtest. The report includes the following:
Type: Type of the position; this can be BUY or SELL
Pair: The pair that was traded in the position
Size: The size of the position reported in lot unit
Open Date: The time when the position was opened
Open Price: The price of the asset when the position was opened
TP Price: Take profit price of the position
SL Price: Stop loss price of the position
Close Date: The time when the position was closed
Close Price: The price of the asset when the position was closed
Closing Reason: The reason the position was closed
Commission: The commission paid for the position
Profit: The profit of the position reported in $
P&L The profit or loss of the position after including the comission reported in $
Duration: The amount of time the position had been open
Balance: The strategy balance after considering the profit/loss of the position
Short Horizon Performance
The Short Horizon Performance reports the strategy performance for each year, quarter, and month during the backtest separately. The following are reported in the table:
Time Period: The time period for which the metrics are being reported
Number of Trades: The total number of positions the strategy has during the time period
: The total profit (or loss) the strategy makes during the time period reported in $ **Average Return (
Min Return: The minimum return the strategy makes by a single position
Max Return: The maximum return the strategy makes by a single position
Median Return: The median of the strategy returns
Returns Std: The standard deviation of the returns
Duration: The duration of all positions the strategy has
Average Duration: The average duration of all positions the strategy has
Number of Wins: The number of positions with a positive return
Wins Profit: The profit made by positions with a positive return reported in $
Average Winning Profit: The average profit made by positions with a positive return reported in $
Wins Duration: Duration of all positions with a positive return
Average Win Duration: The average duration of positions with a positive return
Number of Losses: The number of positions with a negative return
Wins Profit: The profit made by positions with a negative return reported in $
Average Losing Loss: The average loss made by positions with a negative return reported in $
Losses Duration: Duration of all positions with negative returns
Average Loss Duration: The average duration of positions with a negative return