Metrics
The key to making a reliable and robust model is justified evaluation. You can only enhance a model if you know its strengths and weaknesses. There are performance metrics in machine learning that benefit from statistical analysis of the outputs of models. Here at QuantiX, we use these metrics to quantify the performance of models in finding the right buying and selling positions. This article is dedicated to the explanation of such metrics. Before going any further, let's introduce four metrics widely used in obtaining statistical performance metrics: True Positives (TP), True Negatives (TN), False Positives (FP), and False Negatives (FN).

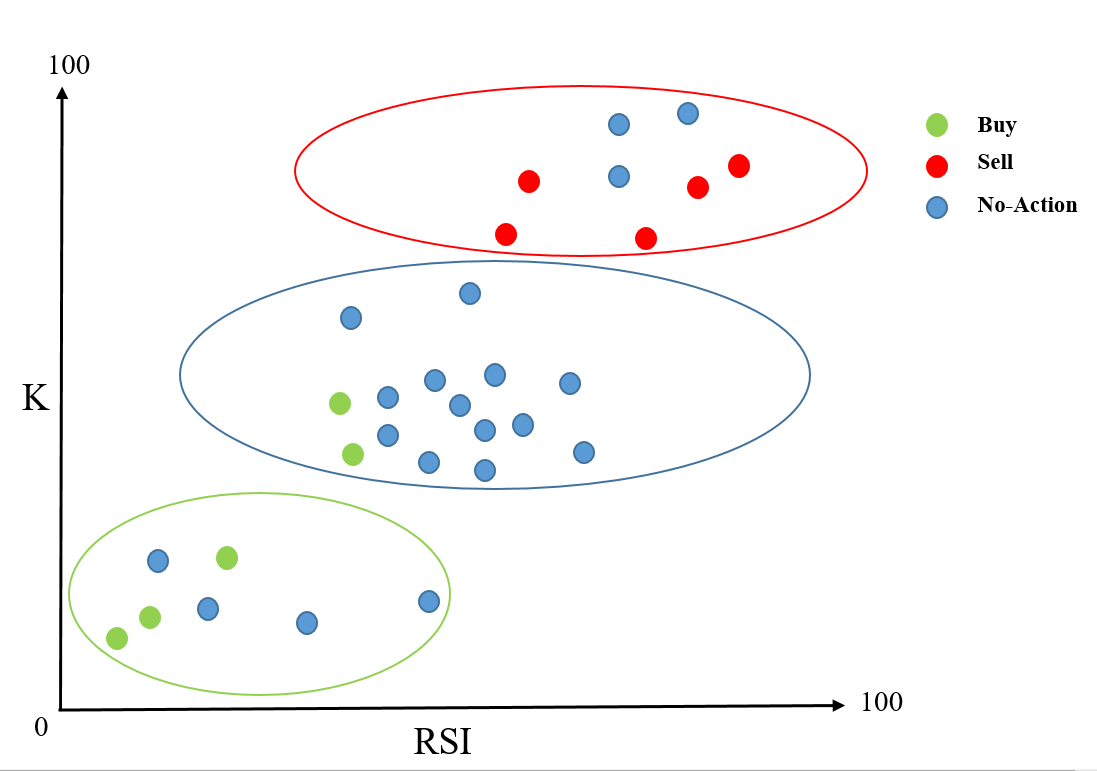
The figure above shows the distribution of 30 candles in a two-dimensional space. The X-axis shows the RSI values of samples, and the Y-axis is the K values of the Stochastic indicator for the candles. We use a target, rally-based rating, for example, to label candles as buy, sell, and no-action. Buy, sell, and no-action samples are shown in green, red, and blue, respectively. Note: If you don't know what targets are, read here. We use a trading model to predict labels for these candles. The candles labeled as buy are those in green ellipse. The samples in blue and green ellipses are those labeled as no-action and buy by the model, respectively. The model is, of course, not perfect and makes some mistakes. For example, two buy samples are misclassified as no-action buy the model. For class X, TP, TN, FP, and FN are metrics that are defined as follows:
True Positives: The number of samples that are class X and correctly classified as that class X
True Negatives: The number of samples that are not in class X and are not classified as class X
False Positives: The number of samples that are not in class X but wrongly classified as class X
False Negatives: The number of samples that are in class X but wrongly classified as other classes
Let's calculate the four mentioned metrics for buy, sell, and no-action classes.
Buy Class
We have five buy samples. Three of those samples are correctly classified as buy by the model, so TP of the buy class is 3. There are 25 samples that are not buy, and the model successfully labels 21 of them as not buy ( they are either labeled as sell or no-action), so TN of the buy class is 21. There are four samples that are not buy but wrongly classified as buy by the model, so FP of the buy class is 4. There are two buy samples wrongly classified as no-action, and thus, FN of buy class is two.
Sell Class
There are five sell samples, and all of these samples are correctly classified as sell, so TP of the sell class is five. There are 25 samples that are not sell, but three of them are misclassified as sell, so TN of the sell class is 22. Three of the samples labeled as sell are not actually sell, and thus, FP of the sell class is three. Lastly, there are no sell samples not classified as sell, so FN of the sell class is zero.
No-Action Class
There are 20 no-action samples in the data. Thirteen of these samples are classified as no-action, so TP of this class is thirteen. There are ten samples that are not no-action, but two of them are classified as no-action. This makes TN of no-action class 8. Two buy samples are wrongly classified as no-action, and thus, FP of the no-action class is two. There are seven no-action classes that are not classified as no-action, so the FN of no-action class is seven.
Precision
Precision is a metric used to evaluate the performance of a machine learning model, specifically in classification tasks. It essentially tells you how accurate your model is when it makes a positive prediction.
A higher precision means your model is better at identifying true positives. For example, if the precision of the buy class is higher than the precision of the sell class, we conclude that when the model labels a candle as buy, the probability of that candle being a real buy is higher than when the model labels something as sell and the candle is a sell. A perfect model has a precision of one. In other words, if a model has a precision of one, it never makes false positives. Based on what is said so far, the precision of buy, sell, and no-action classes in the figure above are 0.42, 0.62, and 0.86, respectively.
Recall
Recall, also known as sensitivity or true positive rate (TPR), is another key metric used in machine learning classification tasks. It complements precision by focusing on a different aspect of a model's performance.
Recall tells you how good your model is at identifying all the relevant cases (actual positives) in your data. In other words, it measures the completeness of your positive predictions.
Mathematically, recall is calculated as the number of true positives divided by the total number of actual positive cases (true positives + false negatives).
A high recall means your model finds most of the relevant instances. If the recall of sell class is higher than the recall of no-action class, this means more actual sells are classified as sell than no-actions classified as no-action statistically. The recall score of a perfect model is one.
How to Interpret Precision and Recall
Note that in most cases, there are trade-offs between precision and recall, and optimizing one might affect the other negatively. Precision is useful in scenarios where false positives are costly. For example, in a medical diagnosis system, a false positive for a disease could lead to unnecessary procedures. Recall is crucial when false negatives are particularly problematic. For instance, a fraud detection system with low recall might miss fraudulent transactions. In trading systems, based on our experiments, precision is more important, especially for opening a position. If you lose buying points in long trading or selling points in short trading (low recall), you will lose chances of making a profit, but if you open positions wrongly (low precision), you may suffer considerable losses, which is not acceptable in terms of risk management. Overall, it would be perfect to have both high precision and recall scores but if you have to choose between them, we suggest choosing precision.
Precision-Recall Area Under Curve (PR-AUC)
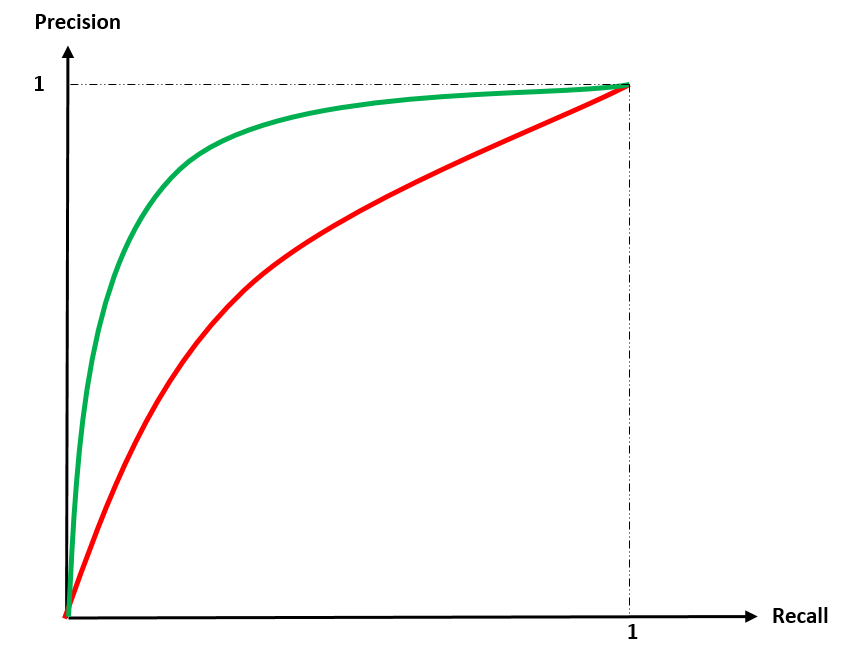
PR-AUC is an evaluation metric used in binary and multi-label classification problems. It assesses a model's ability to distinguish between classes by considering both precision and recall. As is said already, Precision refers to the proportion of true positives among all positive predictions (avoiding false positives). Recall is the proportion of true positives identified correctly (finding most of the true positives). To calculate PR-AUC, we first need to plot the Precision-Recall (PR) curve. A PR curve is generated by plotting precision on the y-axis and recall on the x-axis. The curve is calculated for various classification thresholds. A higher curve indicates better model performance, prioritizing both precision and recall. In the figure below, the performance of the model corresponding to the green curve is superior to that of the red one.

PR-AUC is the area under the PR curve, summarizing the model's overall performance in a single value. A perfect model (perfectly classifying all instances) has a PR-AUC of 1. A random model performs no better than chance and has a PR-AUC equal to the ratio of positive samples in the dataset.
PR-AUC is particularly valuable for imbalanced datasets, where one class has significantly fewer samples than the other. This is the case in trading because the population of no-action samples are considerably larger than the population of buy and sell samples. PR-AUC focuses on the positive class (the one of interest), making it a better choice for imbalanced datasets.
In summary, PR-AUC is a useful metric for evaluating classification models, especially in imbalanced scenarios. It provides a single value that combines precision and recall, giving you a better understanding of how well your model distinguishes between classes.
Receiver Operating Characteristic Area Under the Curve (ROC-AUC)
Receiver Operating Characteristic Area Under the Curve (ROC-AUC) is a metric used to evaluate the performance of binary classification models. It essentially tells you how good your model is at distinguishing between positive and negative classes at various classification thresholds. We can break a model into three binary classifiers, one for the buy class, one for the sell class, and one for the no-action class.
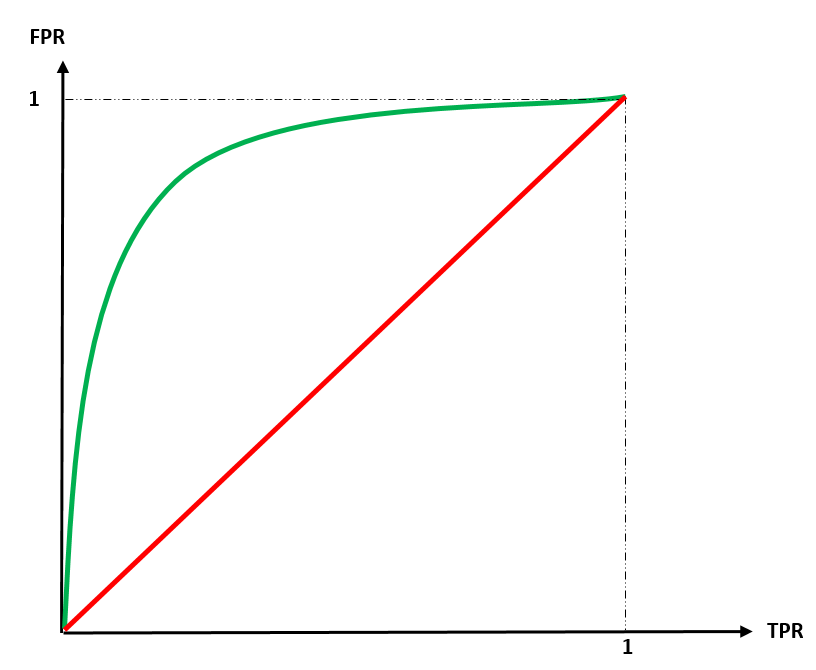
The ROC curve is a graph that plots the True Positive Rate (TPR) on the y-axis against the False Positive Rate (FPR) on the x-axis. TPR is the proportion of actual positives that the model correctly classified. FPR is the proportion of actual negatives that the model incorrectly classified as positives. As the classification threshold (a value used to decide if a prediction is positive or negative) changes, both TPR and FPR change. The ROC curve captures these changes, giving you a visual understanding of the model's performance across different thresholds. The figure below shows ROC curves for two models.

The AUC part of ROC-AUC refers to the Area Under the Curve of the ROC curve. This area summarizes the model's overall performance in a single value between 0 and 1. A perfect model (perfectly classifying all instances) has an AUC of 1. A random model performs no better than chance and has an AUC of 0.5. The higher the AUC, the better the model is at distinguishing between the positive and negative classes. In the figure above, the red curve corresponds to a model that is no better than random guessing but the other one has some ability in correctly classifying samples of the data. One big benefit of this metric is the fact that it considers performance across all thresholds, giving a more comprehensive picture. another advantage of using ROC-AUC is that it is not sensitive to class imbalance. It focuses on the ability to separate the classes, not the number of instances in each class.
Note that like any other metric, ROC-AUC has limitations. Focusing solely on ROC-AUC might not reveal the whole story In highly imbalanced datasets. If the cost of misclassifying certain classes is unequal, ROC-AUC might not be the most appropriate metric. ROC-AUC doesn't directly consider precision and recall, which are important for understanding how well the model identifies true positives and avoids false positives. If you want to consider the precision and recall scores of the model, using PR-AUC is recommended.