Monthly Return Distribution
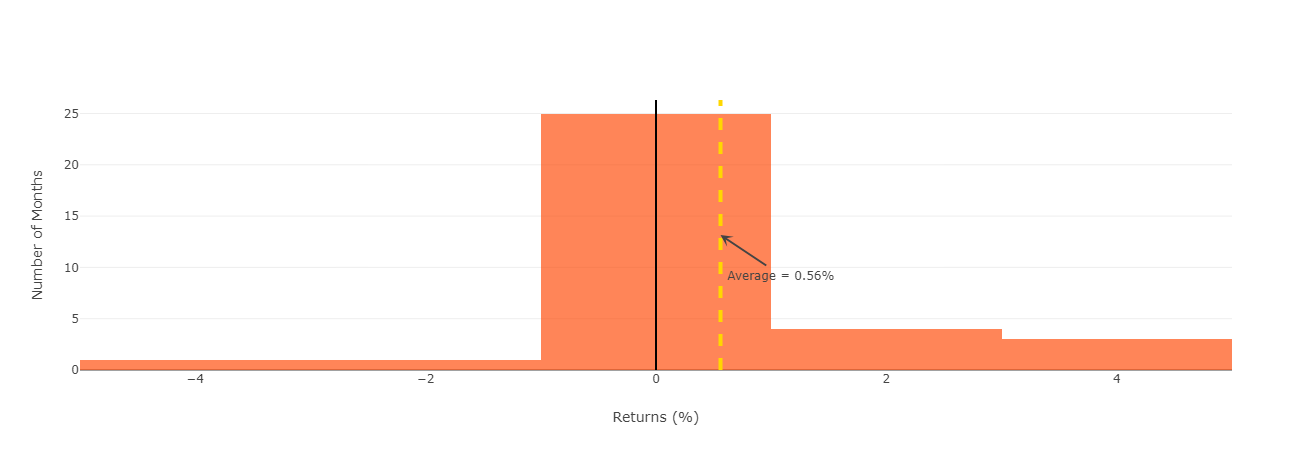
This chart illustrates the distribution of monthly returns, showing how many months the strategy's return fell within specific ranges. It also highlights the average monthly return, representing the expected return over a one-month period.
The chart below corresponds to a strategy that experienced 25 months with returns between -1% and 1%. As observed, the number of months with positive returns exceeding 1% is significantly greater than those with negative returns below -1%, indicating an overall positive strategy performance. This is further reflected in the average monthly return, which is positive. However, despite the strategy's overall positive outcome, there are a few months with returns lower than -1%, which should be considered when evaluating its reliability.

Key Considerations
Strategies with a higher number of months on the positive side of the return axis experience more months with positive returns.
Even a few months with extreme negative returns can cause significant losses.