New Backtest
Running a backtest on the stock or cryptocurrency market includes four main steps:
General
Signal
Position Management
Stop Loss And Take Profit
General
In this step, general configurations of backtests are set. These include:
Name: The name given to the backtest
Market Data: The market data used for the backtest
Pairs: The Pairs included in the backtest
Time Range(s): The periods of time that the backtest will be run for; users can either use time ranges defined in the Time Ranges section of the Tools menu or define a time range by clicking on Open Time range Manager
Timeframe: The timeframe in which the backtest will be run
Fee: The percentage of the broker/exchange commission
Use Leverage: When turned on, a user-defined leverage is applied
Conditional Leverage: When the leverage button is turned on, this option allows the users to define different leverage values for different conditions
Description: An optional short description for the backtest
Signal
In this section, long and short entries and exits are defined. Long Entry is the signal that opens long positions. Long Exit closes long positions. Short Entry and Short Exit signals open and close short positions ,respectively.
Long Trade: When turned on, long trades are enabled
Short Trade: When turned on, short trades are enabled
Position Management
In this section, long and short signal thresholds and also pyramiding settings are configured.
Entry and Exit Thresholds
Thresholds define the number of sub-signals that must be triggered simultaneously to trigger an entry or an exit. Thresholds are set to one by default, and thus if only one of the sub-signals in a mixed signal ( a signal composed of many sub-signals combined by OR operand) is triggered, an entry or exit will initiate. To make entries and exits more conservative, use greater thresholds.
You can use different thresholds for different market conditions by turning Conditional Long Entry Threshold and Conditional Short Entry Threshold. When conditional mode is used, you can set as many scenarios as you want by using signals and selecting thresholds for them. When none of the signals used for the conditional threshold is met, the default value is used.
Pyramiding
Making multiple entries at different prices is called pyramiding. Pyramiding helps you compensate for unexpected uncertainty in the markets and thus is a risk management strategy. Pyramiding reduces the maximum drawdown of strategies when applied properly. To use pyramiding, turn Use Pyramiding on. The following are the parameters of pyramiding.
Pyramiding Type: Controls the pyramiding method. In Signal Based Pyramiding, the system only adds new steps if a new buy signal comes and some other conditions are met (Complementary conditions are explained in the next sections). In contrast, the Average Reduction mode acts independently of the buying signals. This means that whenever the average value of previously purchased steps is reduced by Percentage percent (This is set in Pyramiding Conditions), the strategy adds a new step unless the maximum number of steps is reached (This is set in Number of steps).
Number of Steps: Defines the maximum number of steps that the strategy is allowed to add. For example, if this value is set to 2, then the strategy can execute 2 more buys after a position is opened. After this limit is reached, the strategy ignores any new buy signals until a sell signal is executed. After that, the strategy is once again allowed to add 2 steps and so on.
Conditional Mode: When turned off, the strategy always uses the same number of steps defined in the Pyramiding text box. Using Conditional Mode adds extra flexibility. In this mode, when a position is being opened, a condition is checked, and the maximum number of steps is set accordingly. The conditional mode has a default value which is used when none of the user-defined conditions is met. The user can define as many conditions and their corresponding steps as needed using the Add New Row button. Note that the strategy evaluates the conditions from top to bottom. This means that if two or more conditions are met simultaneously, the strategy uses the value of the condition closer to the top.
Pyramiding Size: Sets the size of pyramiding steps with respect to the initial buy order size. When Simple Mode is used, the sizes of all steps are the same as the size of the initial buy. Inspired by Martingale mathematics, the Martingale Mode uses a multiplier to increase the size of the latter steps. For example, when the martingale mode is used, and the multiplier value is set to 2, the first step size would be two times bigger than the initial step. The second pyramiding step size would be four times bigger than the initial step, and so on. By using the Custom mode, the user can define the size of each step with respect to the size of the initial buy. To do so, type step a step size and press enter to go to the next one.
Pyramiding Conditions: Adds complementary constraints to the pyramiding strategy. Percentage Cool Down defines the minimum decrement in the price measured in percentage unit that is needed for a new buy order to be taken into account if Regular mode is used. When the Average Reduction mode is used, the strategy waits for the price to decrease by Percentage percent and if the maximum number of steps is not reached, it adds a new step. The Reference could be Average, Last, or First. Average uses the average price of the previous steps as the reference. Last uses the price of the last step as the reference and First uses the price of the initial buy. The percentage type could be either Memory or Current. Current looks at the price of the current candle and memory checks the price of all the previous candles. If a buy signal comes and the price of any candle in the previous candles from the last buy to the current candle has reached the threshold percentage defined in the Percentage textbox, a new step will be added. Percentage cooldowns could be defined by using Conditional Percentage Cool Down. The logic is similar to Conditional Pyramiding. The default percentage value is used when none of the next conditions is met. Users can define their signals and corresponding values sorted in descending order with respect to their priorities. Candle Cool Down defines the minimum number of candles needed between two steps no matter if Average Reduction or Regular mode is used.
Stop Loss And Take Profit
Multiple stop loss and take profit orders are available. By default, stop loss and take profit are disabled, but you can use one of the following methods to control your risk.
Normal Stop Loss
Normal Stop Loss use a constant value as stop loss percent. For example, if you set the Stop Loss Percent to 5, the stop loss is triggered if the price drops by 5 percent from the opening price of the position. If you turn Offset ON, you can change the constant with respect to price movements.
Stop Loss Percent: The price change in percent that triggers stop loss order to close a position
Offset: When turned on, the Stop Loss Percent is changed to another value with respect to price movements.
Stop Positive Offset Percent (shown when Offset is ON): The price increment in percent needed in a long position to change stop loss value. For a short position, it is the necessary price decrement in percent to change stop loss percent value.
Stop Positive Percent: The stop loss percent used when the price matches the Stop Positive Offset Percent condition
Example
If you set the Stop Loss Percent to 5 and your strategy opens a long position in XYZ/USD when the price is
Time-Dependant Stop Loss
Time-Dependent stop loss counts the number of candles from the opening candle of the position and sets the stop loss value based on the time passed from the position opening. In this method, you can set as many stop losses as you want
Candle Range: Used to define a time horizon for a stop loss value; the opening candle of the position is candle number 0; the right-side number in a range sets the end of a time horizon, and the left-side number defines the horizon's beginning.
Value: The stop loss associated with a time horizon
Force Exit: If selected, the position will be closed at the end of the associated time horizon.
Example
If you use the Time-Dependent stop loss, as is shown in the figure below, the stop loss of a position is set to 5 after it is opened and will be 5 for the next ten candles. After ten candles, the stop loss is set to 3 for the next 20 candles (candle 10 to candle 30), and after 30, the stop loss closes the position. If Force Exit is not checked, the stop loss remains 3 percent until the position is closed by the stop loss or an exit signal.

Trailing Stop Loss
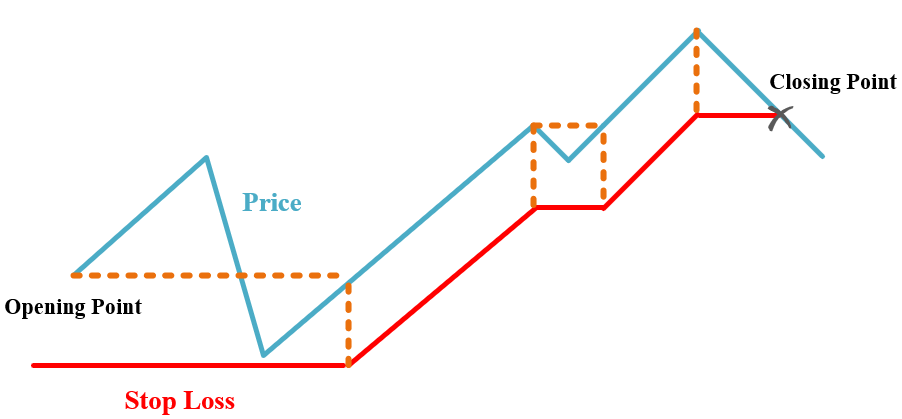
The Trailing Stop Loss moves with the price to secure profits. This stop loss updates its values in real-time ( it is updated every five seconds). In long positions, it moves up if the price reaches higher prices, and in short positions, it moves down if the price hits lower prices.
The figure below shows how trailing stop loss works

The inputs of this stop loss are:
Stop Loss Percent: The value of the stop loss in percent
Offset: When turned on, the Stop Loss Percent is changed to another value with respect to price movements.
Stop Positive Offset Percent (shown when Offset is ON): The price increment in percent needed in a long position to change the stop loss value. For a short position, it is the necessary price decrement in percent to change the stop loss percent value.
Stop Positive Percent: The stop loss percent used when the price matches the Stop Positive Offset Percent condition
Trailing Before Offset: If turned ON, the stop loss trails the price before the Stop Positive Offset Percent's condition is met.
Trailing After Offset: If turned ON, the stop loss trails the price after the Stop Positive Offset Percent's condition is met.
Dynamic Stop Loss
The Dynamic Stop Loss uses numerical features. Using this stop loss, you can trigger a stop loss order if the price hits a price level defined by features. The inputs of this stop loss are: Numerical Features: Features used to define the stop loss Stop Loss Level: Defines the level that triggers stop loss. Update Calculations for New Candles: If turned ON, the stop loss level is updated after each candle is closed. When turned OFF, the stop loss level is calculated when the position is opened and is fixed until the position is closed.
Example
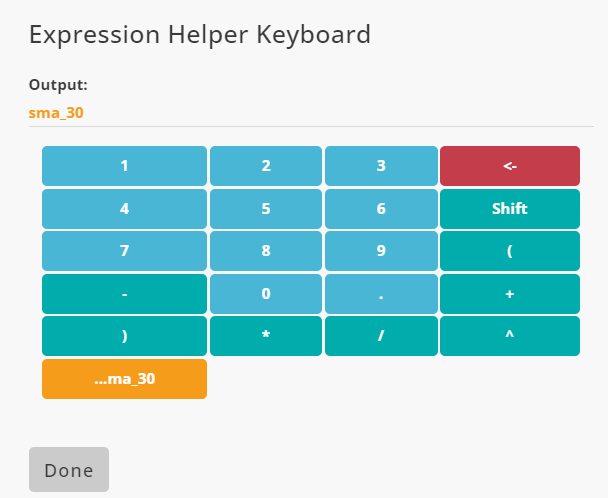
If you want your positions to close when the price hits the SMA 30, select the Dynamic Stop Loss from the list and mark sma_30 in the Numerical Features. Note that you should add sma_30 in advance if you want to use it here and fill Stop Loss Level as is shown in the figure below.

Conditional Stop Loss
This stop loss checks a series of signals and updates the value of the stop loss. The system continuously checks selected signals and if a signal is triggered, the associated value with the signal is used as the stop loss percent.It is like a Normal Stop Loss without offset that has different values concerning a series of signals. If two or more signals are triggered simultaneously, the value of the signal with higher priority is used. The inputs of this stop loss are:
Signal: A signal that sets a value for stop loss percent
Value: A value used as the stop loss percent when its signal is triggered
Example
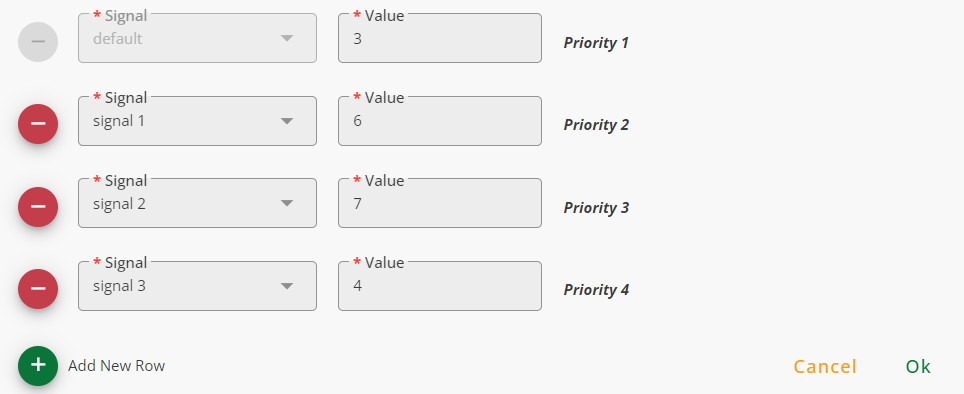
If you use the Conditional Stop Loss as is shown in the figure below, when none of the signals is triggered, the stop loss percent's value is 3. If signal 2 is triggered, the value of the stop loss percent becomes 7. If signal 1 and signal 3 are triggered simultaneously, the value of the stop loss percent will be 6.

Normal Take Profit
Normal Take Profit use a constant value as take profit percent. For example, if you set the Take Profit Percent to 5, the take profit is triggered if the price raises by 5 percent from the opening price of the position. If you turn Offset ON, you can change the constant with respect to price movements.
Take Profit Percent: The price change in percent that triggers take profit order to close a position
Offset: When turned on, the Take Profit Percent is changed to another value with respect to price movements.
Take Negative Offset Percent (shown when Offset is ON): The price decrement in percent needed in a long position to change take profit value. For a short position, it is the necessary price increment in percent to change take profit percent value.
Take Negative Percent: The take profit percent used when the price matches the Take Profit Offset Percent condition
Example
If you set the Take Profit Percent to 5 and your strategy opens a long position in XYZ/USD when the price is
Time-Dependant Take Profit
Time-Dependent take loss counts the number of candles from the opening candle of the position and sets the take profit value based on the time passed from the position opening. In this method, you can set as many take profits as you want
Candle Range: Used to define a time horizon for a take profit value; the opening candle of the position is candle number 0; the right-side number in a range sets the end of a time horizon, and the left-side number defines the horizon's beginning.
Value: The take profit associated with a time horizon
Force Exit: If selected, the position will be closed at the end of the associated time horizon.

Trailing Take Profit
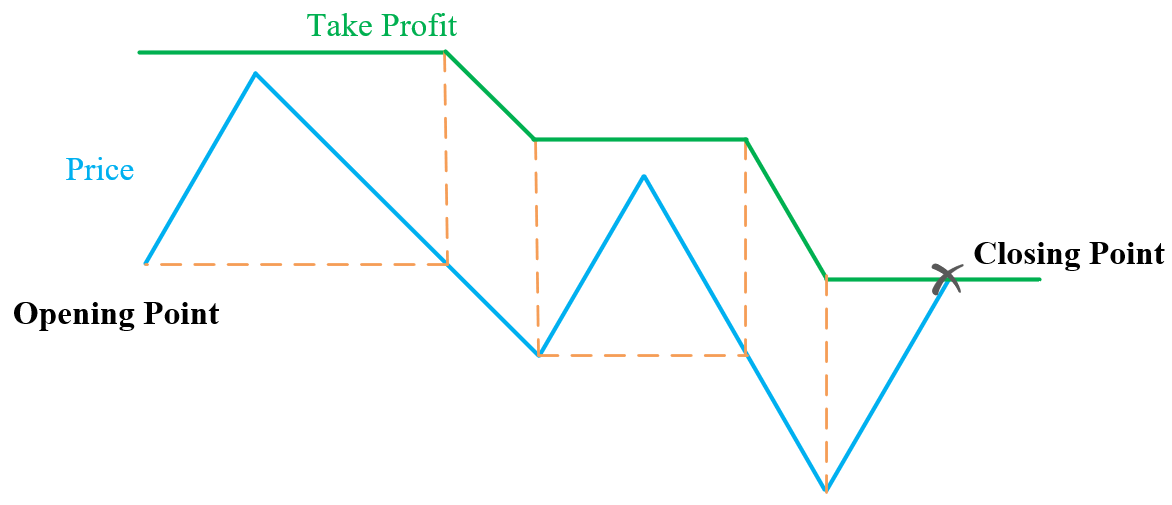
The Trailing Take Profit moves with the price to secure profits. This take profit updates its values in real-time ( it is updated every five seconds). In long positions, it moves down if the price reaches lower prices, and in short positions, it moves up if the price hits higher prices.
The figure below shows how trailing take profit works

The inputs of this take profit are:
Take Profit Percent: The value of the take profit in percent
Offset: When turned on, the Take Profit Percent is changed to another value with respect to price movements.
Take Negative Offset Percent (shown when Offset is ON): The price decrement in percent needed in a long position to change the take profit value. For a short position, it is the necessary price increment in percent to change the take profit percent value.
Take Negative Percent: The take profit percent used when the price matches the Take Negative Offset Percent condition
Trailing Before Offset: If turned ON, the take profit trails the price before the Take Negative Offset Percent's condition is met.
Trailing After Offset: If turned ON, the take profit trails the price after the Take Negative Offset Percent's condition is met.
Dynamic Take Profit
The Dynamic Take Profit uses numerical features. Using this take profit, you can trigger a take profit order if the price hits a price level defined by features. The inputs of this take profit are: Numerical Features: Features used to define the take profit Take Profit Level: Defines the level that triggers take profit. Update Calculations for New Candles: If turned ON, the take profit level is updated after each candle is closed. When turned OFF, the take profit level is calculated when the position is opened and is fixed until the position is closed.
Example
If you want your positions to close when the price hits the SMA 30, select the Dynamic Take Profit from the list and mark sma_30 in the Numerical Features. Note that you should add sma_30 in advance if you want to use it here and fill Take Profit Level as is shown in the figure below.

Conditional Take Profit
This take profit checks a series of signals and updates the value of the take profit. The system continuously checks selected signals and if a signal is triggered, the associated value with the signal is used as the take profit percent. It is like a Normal Take Profit without offset that has different values concerning a series of signals. If two or more signals are triggered simultaneously, the value of the signal with higher priority is used. The inputs of this take profit are:
Signal: A signal that sets a value for take profit percent
Value: A value used as the stop loss percent when its signal is triggered
Example
If you use the Take Stop Loss as is shown in the figure below, when none of the signals is triggered, the stake profit percent's value is 3. If signal 2 is triggered, the value of the take profit percent becomes 7. If signal 1 and signal 3 are triggered simultaneously, the value of the take profit percent will be 6.
