Portfolio vs Buy and Hold
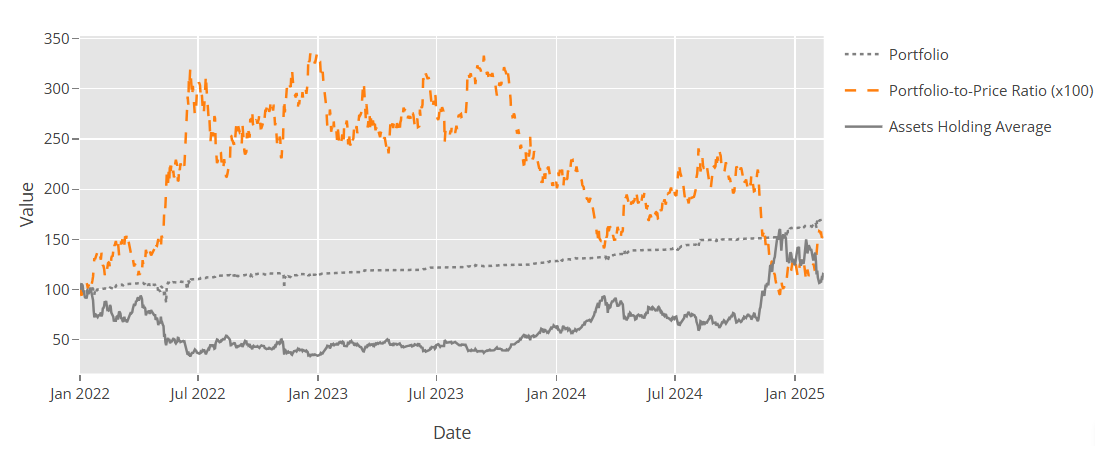
This report compares the strategy's performance against buy and hold during the backtest period. The X-axis represents the date, while the Y-axis represents the value of the strategy's portfolio, which always starts at 100.
The graph contains three lines:
Portfolio (Dashed Line): Represents the strategy's portfolio value over time.
Buy and Hold (Solid Line): Represents the performance of the buy and hold strategy. If the report is generated for a single pair, this line reflects the asset's price movement during the backtest period. In portfolio mode, it shows the performance of a portfolio of assets, weighted according to the Portfolio Ratio field.
Portfolio to Buy and Hold Ratio (Orange Dashed Line): Calculated by dividing the strategy's portfolio value by the buy-and-hold portfolio's value and multiplying the result by 100. A value above 100 indicates that the strategy outperforms the buy and hold return, with higher values representing greater superiority.
