QuantiX Numeric Functions
Advanced Calculator
Advanced Calculator is used to perform mathematical operations. This function helps you make new columns of data using mathematical operations between two numeric columns. It supports four basic operations (addition, subtraction, multiplication, and division) and power. You can also shift columns to give more flexibility to the mathematical equations you define.
The inputs of this function are explained in the table below.
Field | Description |
|---|---|
Timeframes | The timeframes in which the function is applied. |
References | The indicators or OHLCV data included in the calculations. |
Equation | Define your mathematical equation here. |
Replace NaN Values | When turned on, all NaN values in the output will be replaced by the value you define in the next input. Note: NaN stands for "Not a Number" and occurs when one or more references lack values. |
NaN Substitute | When Replace NaN Values is ON, NaN values are replaced by the value defined in this field. |
Output Column Name(s) | The name given to the column that stores the result. |
Example
To calculate the average value of the high and low prices for each candle, select high and low from the list in the References and define the following equation in the Equation:
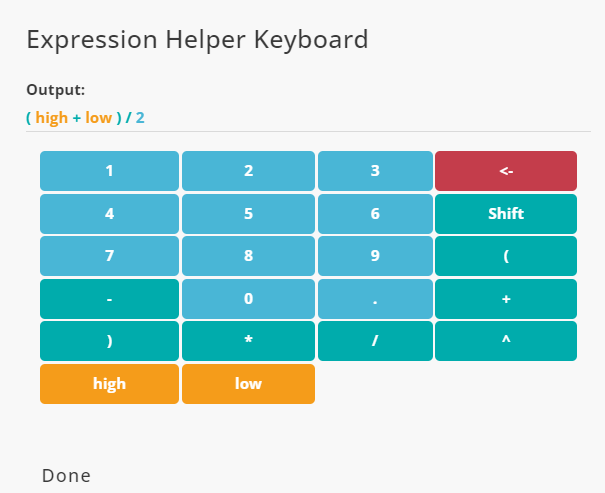
using the Grid tool, you can see that average value of high and low prices are calculated and stored in a new column:

Arithmetic
Arithmetic applies mathematical operations to the features. The function supports add, subtract, multiply, divide, power, and residual operations.
The following are the inputs of this function.
Field | Description |
|---|---|
Timeframes | The timeframes in which the function is applied. |
First Feature | The first line used for calculation. |
Second Feature | The second line used for calculation. |
Operand | The operand to be applied. |
Output Column Name(s) | The name given to the output column. |
Example
To find the differences of the close and the open prices of the candles, use the Arithmetic function in the following manner:
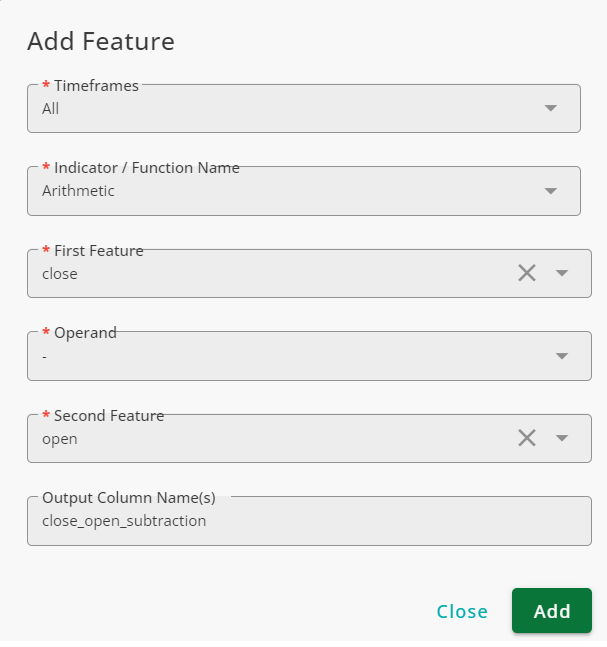
If you use Grid, you will see that the output column contains the subtraction of open from the close. 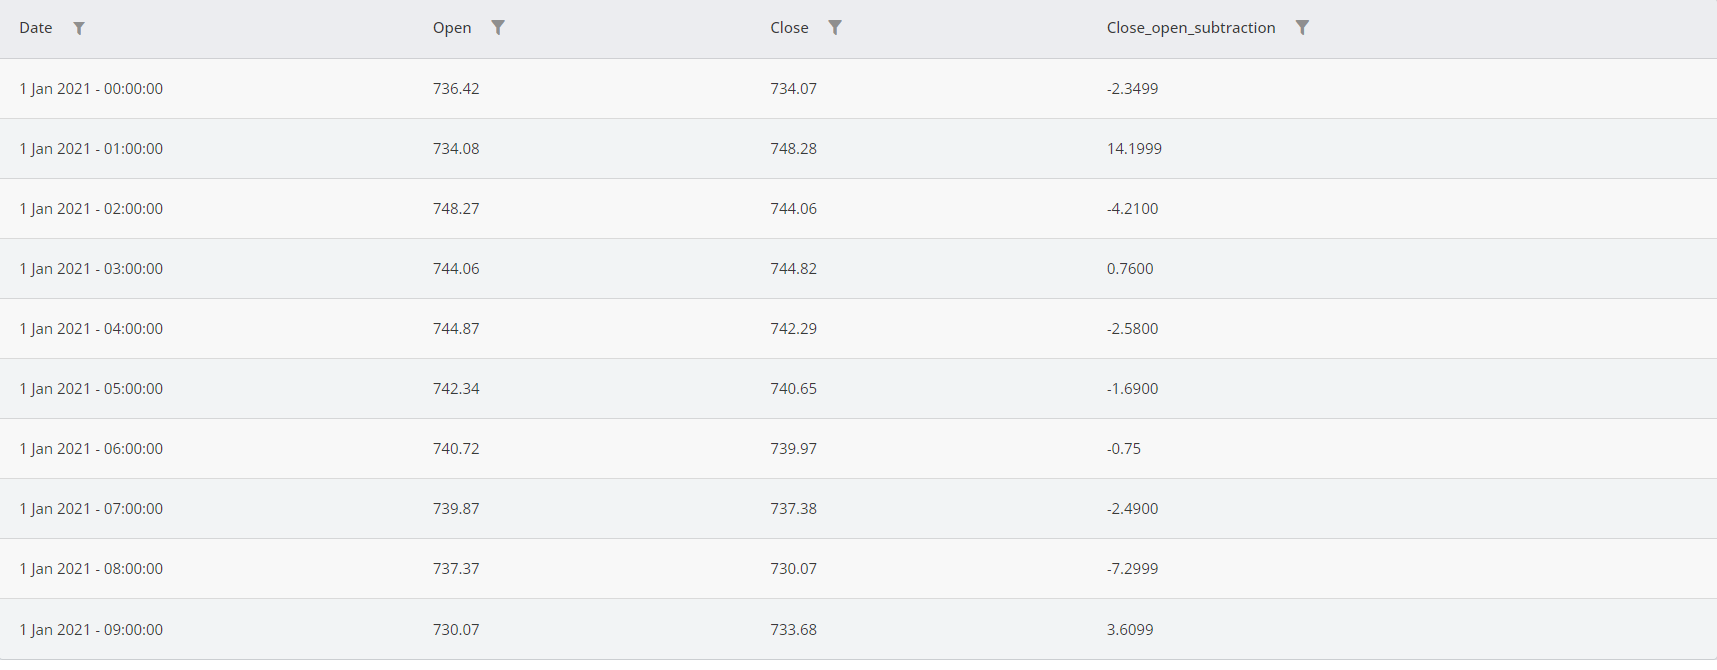
Cyclical Time Features
Time features are cyclical, meaning their values repeat after a fixed period. For example, the hour of the day repeats every 24 hours, and the month number repeats every 12 months.
To account for this cyclicality—and to avoid introducing bias toward larger numeric values—time features are commonly encoded using sine and cosine functions. This approach preserves the circular nature of time.
This function encodes time features using both sine and cosine. When using time features in machine learning models, both the sine-encoded and cosine-encoded columns should be included.
Input | Description |
|---|---|
Timeframes | The timeframes in which the function is applied. |
Datetime Component | The name of the time feature you want to encode. |
Period | The length of the repeating cycle. This value depends on the natural cycle of the time feature. It is typically 24 for hours, 7 for the day of the week, 31 for the day of the month, and 12 for months. |
Output Column Name(s) | The name of the column used for storing the result. component_s contains sine-encoded and component_c contains cosine-encoded version of the selected time feature using Datetime Components. |
Datetime Components
Datetime Components adds time features extracted from candle timestamps, including the hour, day of the week, day of the month, and month number.
Note that using these raw time features directly in machine learning models can be problematic. Instead, we recommend using their sine- and cosine-encoded versions.
To learn more, see the Cyclical Time Features and Time Context documentation.
Input | Description |
|---|---|
Timeframes | The timeframes in which the function is applied. |
Output Column Name(s) | The name of the column used for storing the result. |
Diameter
The Diameter function returns the normalized distance between two indicators with respect to their previous values. This is useful when measuring the relative closeness of two features.
The inputs of the function are explained in the table below.
Input | Description |
|---|---|
First Indicator | The name of the first feature used in the analysis. |
Second Indicator | The name of the second feature used in the analysis. |
Window Length | The size of the window in which the distances between the two indicators are normalized to the range of zero to one. |
Output Column Name(s) | The name of the column used for storing the result. |
Note that First Indicator and Second Indicator Name must be numeric features.
Example
Bollinger Bands is a widely used technical indicator, often utilized to assess market conditions. One key way to interpret this indicator is by analyzing the distance between the upper and lower bands:
When the bands are far apart, the asset is experiencing high volatility.
When the bands are close together, the asset's volatility is low.
A large distance between the bands can indicate a potential upcoming rally.
When the bands are already far apart, it may signal that a trend or rally is nearing its end.
To quantify the distance between the two bands, we use the Distance function.
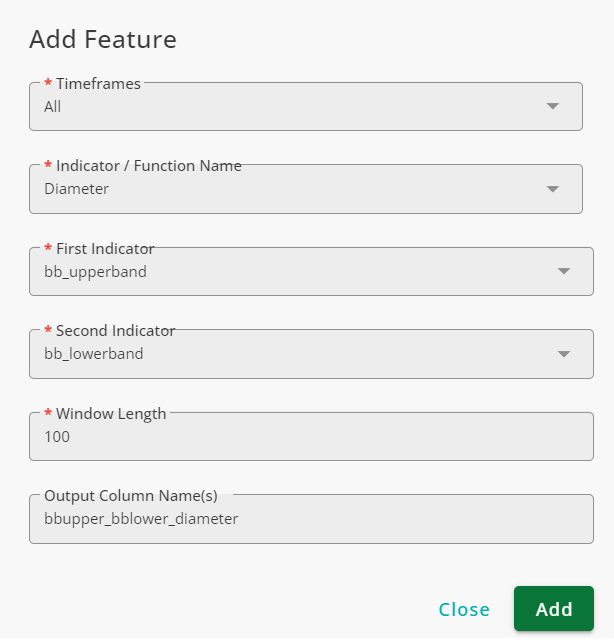
Using the configurations above, the Diameter function analyzes the last 100 candles and measures the distance between the Bollinger Bands for each candle. The function normalizes the distances on a scale from 0 to 1:
1 → The widest band distance in the last 100 candles.
0 → The narrowest band distance in the last 100 candles.
Key Considerations
Since distances are normalized, two candles with the same reported value do not necessarily have the same absolute band distance.
The reported distance is always relative to the past 100 candles.
Holidays
This function adds a column indicating whether a candle occurs on a holiday. A value of 1 means the candle falls on a holiday; otherwise, the value is 0.
Note: Only U.S. calendar holidays are included.
Input | Description |
|---|---|
Timeframes | The timeframes in which the function is applied. |
Output Column Name(s) | The name of the column used for storing the result. |
Normalized Slope
A common method to determine the trend direction is to examine the rate of change (slope) between two candles. However, raw slope values can be misleading due to scale variations.
The Normalized Slope function adjusts the rate of change between two candles to a range of -50 to 50, ensuring a uniform distribution of values.
The normalization properties include a uniform distribution where 5% of the data has a normalized slope between 45 and 50. Exactly 50% of the data has a positive slope, and 50% has a negative slope.
This makes trend analysis more consistent and easier to interpret across different assets and timeframes.
The inputs of the function are listed in the table below.
Input | Description |
|---|---|
Timeframe(s) | The timeframe(s) in which the function is applied. |
Feature Name | The feature used for slope calculations. |
Normalization Window Length | The number of past candles used for normalizing slopes. Using values that are too large or too small may result in unreliable outcomes. |
Output Column Name(s) | The name of the column where the result is stored. |
Middle
The middle function returns the middle value ( the mean value) of two feature. The function has four inputs, which are explained in the table below.
Input | Description |
|---|---|
Timeframes | The timeframes in which the function is applied. |
First Feature | The name of the first line used in the analysis. |
Second Feature | The name of the second line used in the analysis. |
Output Column Name(s) | The name given to the result column. |
Example
To obtain the middle values of high and low prices for candles, use the Middle function the way shown in the figure below:
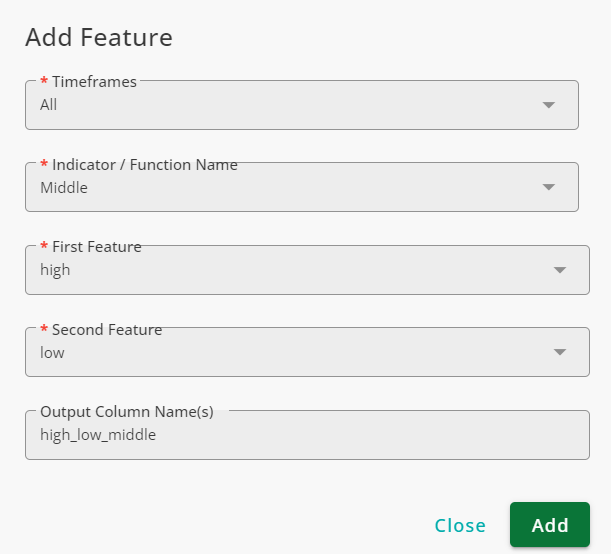
The result is shown in the figure below:
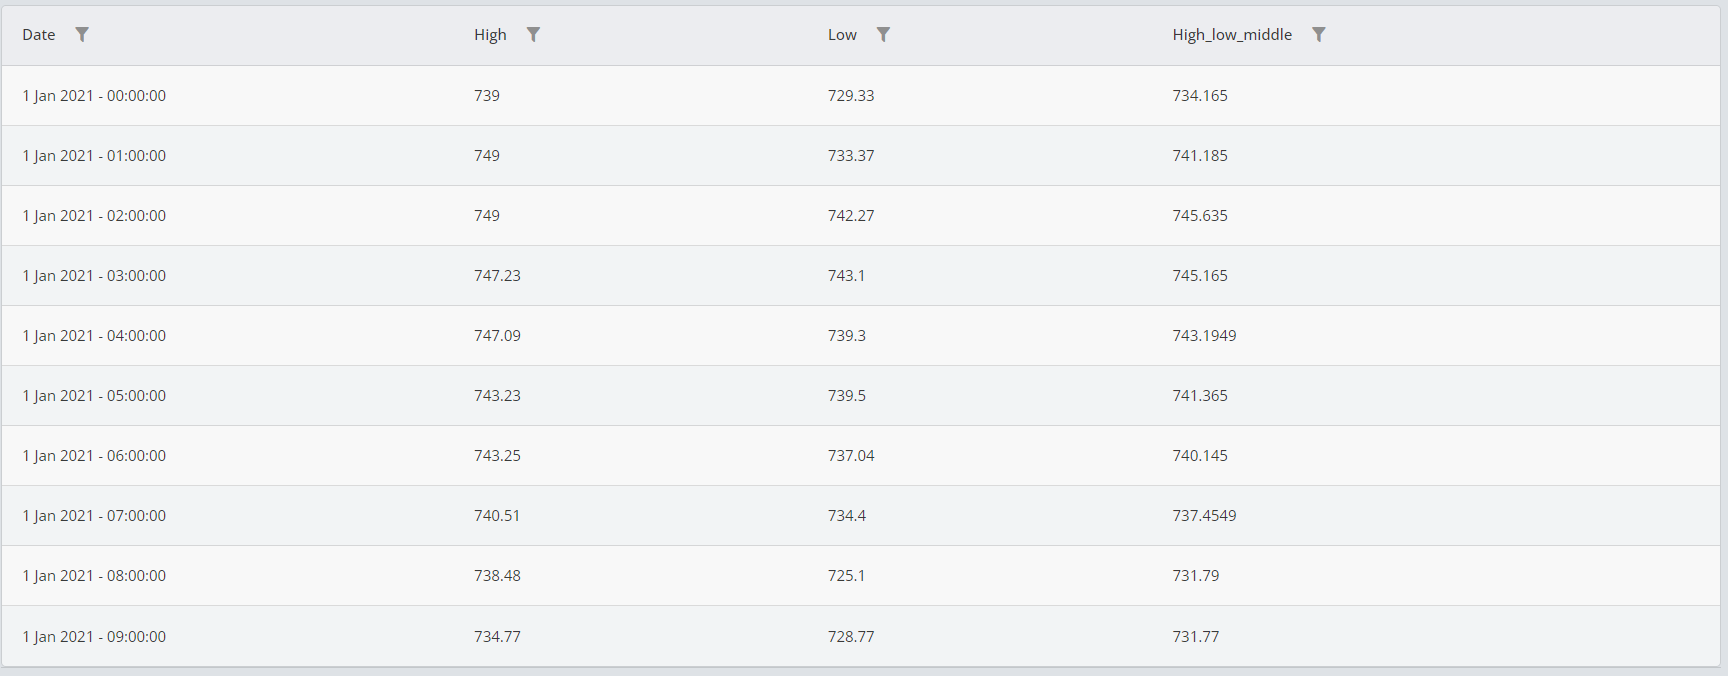
As is shown in the table, the output of the function contains the middle value (mean value) of the high and low prices for each candle.
Shift
The Shift function shifts the data of a column for a user-defined number of candles. In other words, the function moves the values of a column on the time axis. Note that when negative numbers are used as shift values, the data of the future is shown in the result, so the result cannot be used for analysis.
The inputs of the function are explained below.
Field | Description |
|---|---|
Timeframes | The timeframes in which the function is applied. |
Feature | The feature that is shifted by the function. |
Value | The number of candles by which you want to shift the feature. |
Fill Value | The value used to fill the rows that become empty due to shifting. |
Output Column Name(s) | The name of the column in which the result is stored. |
Example
To show how this function works, we shift the open price two times, once with +2 as the shift value and once with -2 as the shift value. The configuration of the function for the first scenario is illustrated in the figure below:
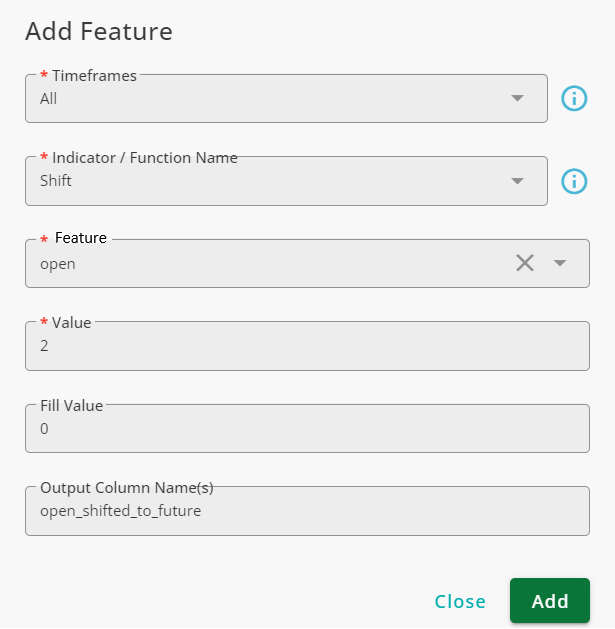
We name the output open_shifted_to_future because we move the data to the future. This data can be used in the analysis because, for any candle, the data is coming from previous candles, which is normal. To compare the results, we use the shift function with -2 as the shift value and save the results in a column named open_shifted_to_past. The results of the two scenarios are shown in the figure below.
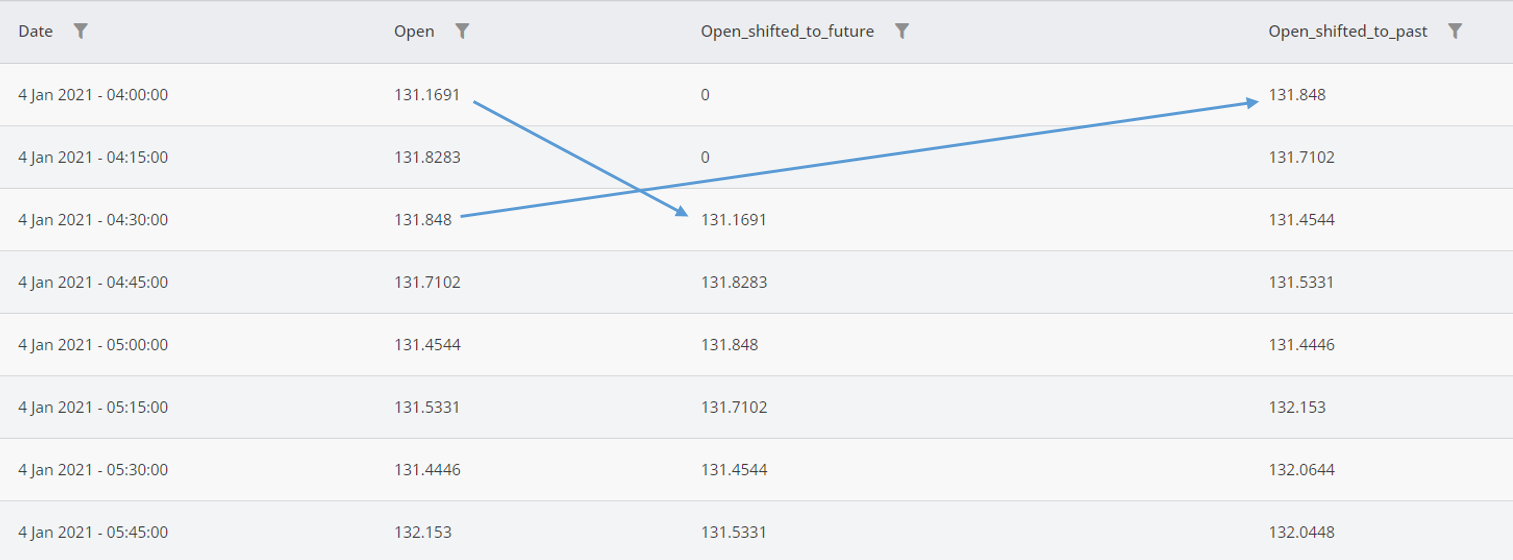
As is shown in the figure above, the values in the open_shifted_to_past come from the future and the values of open_shifted_to_future come from the past. The first two rows of open_shifted_to_future as filled with zero because we set Fill Value to zero.
Uniform Random
Use the Uniform Random function to create a column containing random numbers that follow a uniform distribution. The most prominent feature of uniform distribution is that the probability of all numbers in the range is equal. The inputs of the function are listed in the table below.
Field | Description |
|---|---|
Timeframes | The timeframe(s) in which the function is applied. |
Upper Limit | The upper limit of the numbers. |
Lower Limit | The lower limit of the numbers. |
Output Column Name(s) | The name of the column in which the result is stored. |
Example
To add a column of random numbers with uniform distribution, the Uniform Random function is used with the following settings:
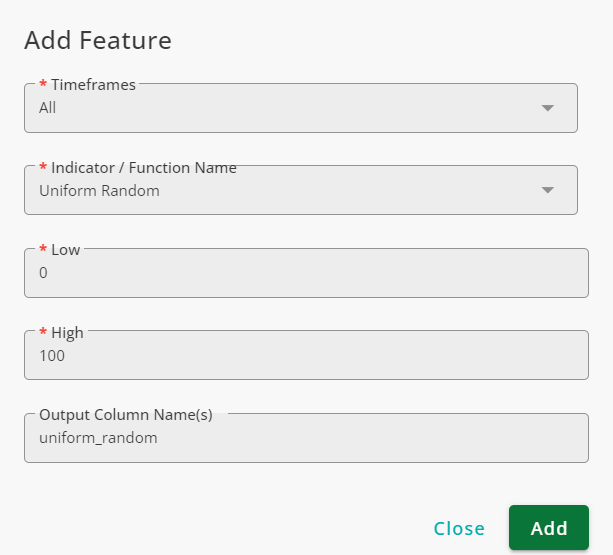
The values of this column is shown in the figure below.

Values of the output of the function is shown below.

Time Context Features
Use this function to add all time features, their encoded versions, and holiday data in a single step.
This function first applies Datetime Components, then creates encoded versions of those outputs using Cyclical Time Features. The outputs of both functions are added to your dataset.
Field | Description |
|---|---|
Timeframes | The timeframes in which the function is applied. |
Output Column Name(s) | The name of the column in which the result is stored. |