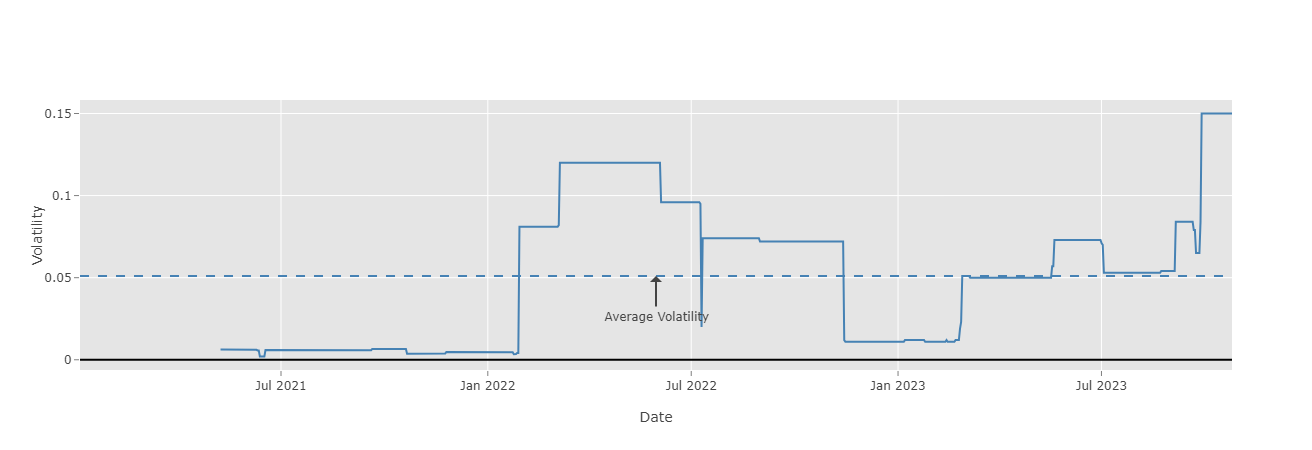
Rolling Volatility
The Rolling Volatility represents the strategy's volatility over a six-month period, calculated for each data point using the standard deviation of daily returns from the past six months. This volatility is expressed as a percentage of the strategy's total fund.
Since there isn't enough data for calculation, rolling volatility is unavailable for the first six months of the backtest. Additionally, the average volatility of the strategy is displayed in the chart as a dashed line for reference.

Key Considerations:
Higher volatility indicates greater fluctuations in the strategy's portfolio value.
Rolling volatility that remains close to the average volatility over time suggests greater reliability and predictability in portfolio movements.
Last modified: 28 April 2025