Targets
Targets rate candles based on their past and future. In other words, targets look at the previous and upcoming candles and return labels or numbers for each candle.
We have two types of targets
Categorical: Targets that return labels (usually buy, sell, no-action)
Numerical: Targets that return numbers ranging from a minimum to a maximum
Categorical Targets
Categorical targets return labels for candles and are used for training classifier models and statistical analysis methods that need labels. The categorical targets available in QuantiX are:
Rally-Based Classifying
Stoploss-Takeprofit Classifying
Reward Risk Classifying
Positive Momentum Classifying
Below are the explanations for each of these targets
Rally-Based Classifying
This target finds rallies by using local minimums and maximums in the price and then labels close candles to minimums as sell and close candles to maximums as buy. To find local minimums and maximums, Pivot function is used. To read more about this function, here.
Pivot Window Length: The window length of the Pivot function
Buy Threshold: The percentage of rallies closest to a low pivot labeled as buy
Sell Threshold: The percentage of rallies closest to a high pivot labeled as sell
Labels: The labels given to candles that fall in buy, no-action and sell ranges, respectively
Target Name: The name given to the output column
To learn more about Rally-Based Classifying and learn how to use it, here.
Stoploss-Takeprofit Classifying
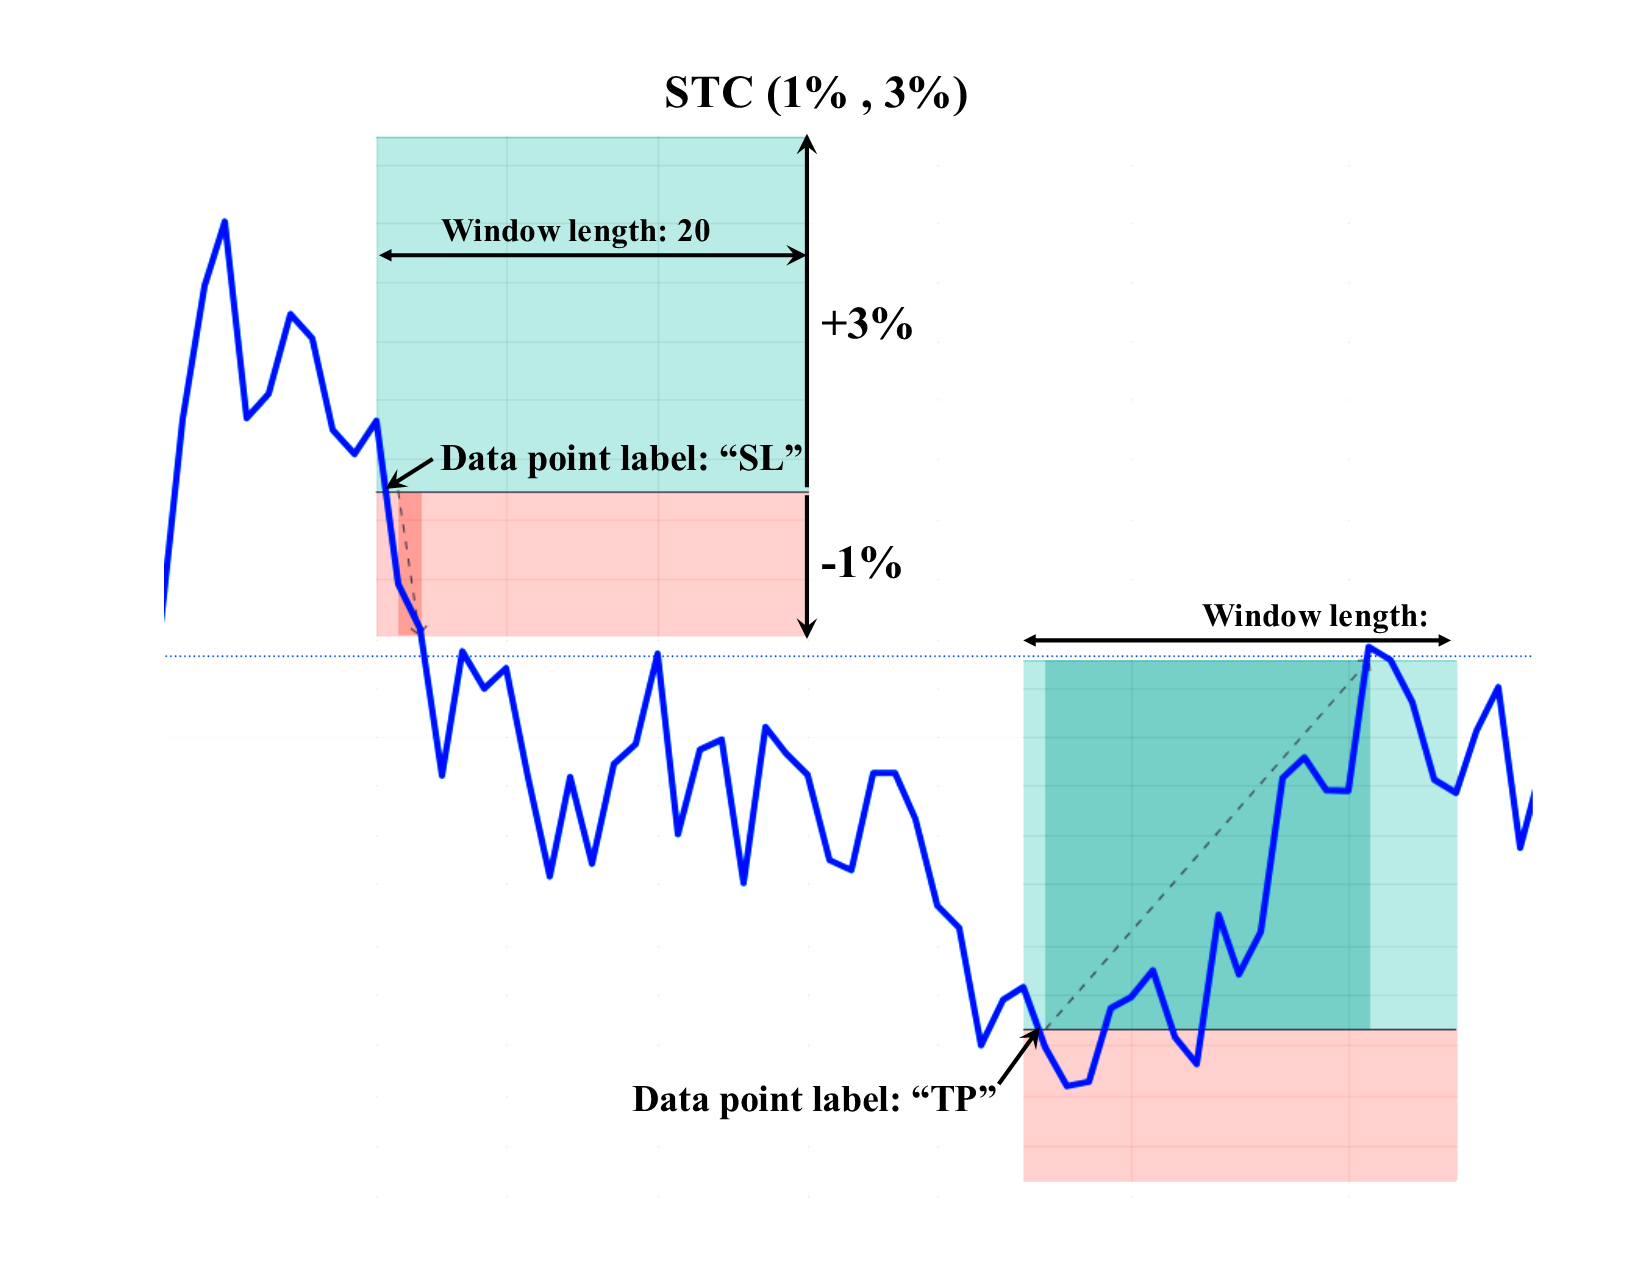
This target labels candles based on future price movements within a time window of a specified length. If the price increases by a percentage defined by Take Profit Percentage, the candle is labeled TP (Take Profit). If the price drops by Stop Loss Percentage percent, the candle is labeled SL (Stop Loss). Any candle that is not TP or SL is labeled NA (No-Action). Note that if both stop loss and take profit orders are hit in a window, the target considers the order reached sooner.
The inputs of this target are:
Look Ahead Window Length: The number of candles considered for hitting take profit or stop loss
Trade Type: Define the trade side that you want to use this target for; it can be Long or Short
Stop Loss Percentage: The stop loss value (in percent)
Take Profit Percentage: The take profit value (in percent)
Labels: Labels given to candles
target name: The name given to the output column
The figure below illustrates the target behavior. Using this target with Take Profit Percentage and Stop Loss Percentage values of 3 and 1, respectively, the labels for the first and the second window are SL and TP, respectively.

To learn more about Stoloss-Takeprofit Classifying and learn how to use it, here.
Reward Risk Classifying
Reward Risk Classifying measures the maximum run-up and drawdown in the forward-looking window with a defined window size. The reward and risk are defined as (maximum run-up/maximum drawdown) and (maximum drawdown/maximum run-up), respectively. If the reward or risk exceeds user-defined thresholds, the candle is labeled buy or sell, respectively. The inputs of this target are:
Look Ahead Window Length: The size of the window in which drawdown and run-up are calculated for candles
Risk/Reward Ratio For Sell Label: Sell threshold
Reward/Risk Ratio For Sell Label: Buy threshold
labels: Labels given to candles
target Name: The name given to the output column To learn more about Reward Risk Classifying and learn how to use it, here.
Gain Based Rating
Gain Based Rating is a numeric target that quantifies price behaviors within a forward-looking window with a user-defined window length. As its name implies, it reports rates (not percentages). The inputs of this target are:
Look Ahead Window Length: The size of the forward-looking window
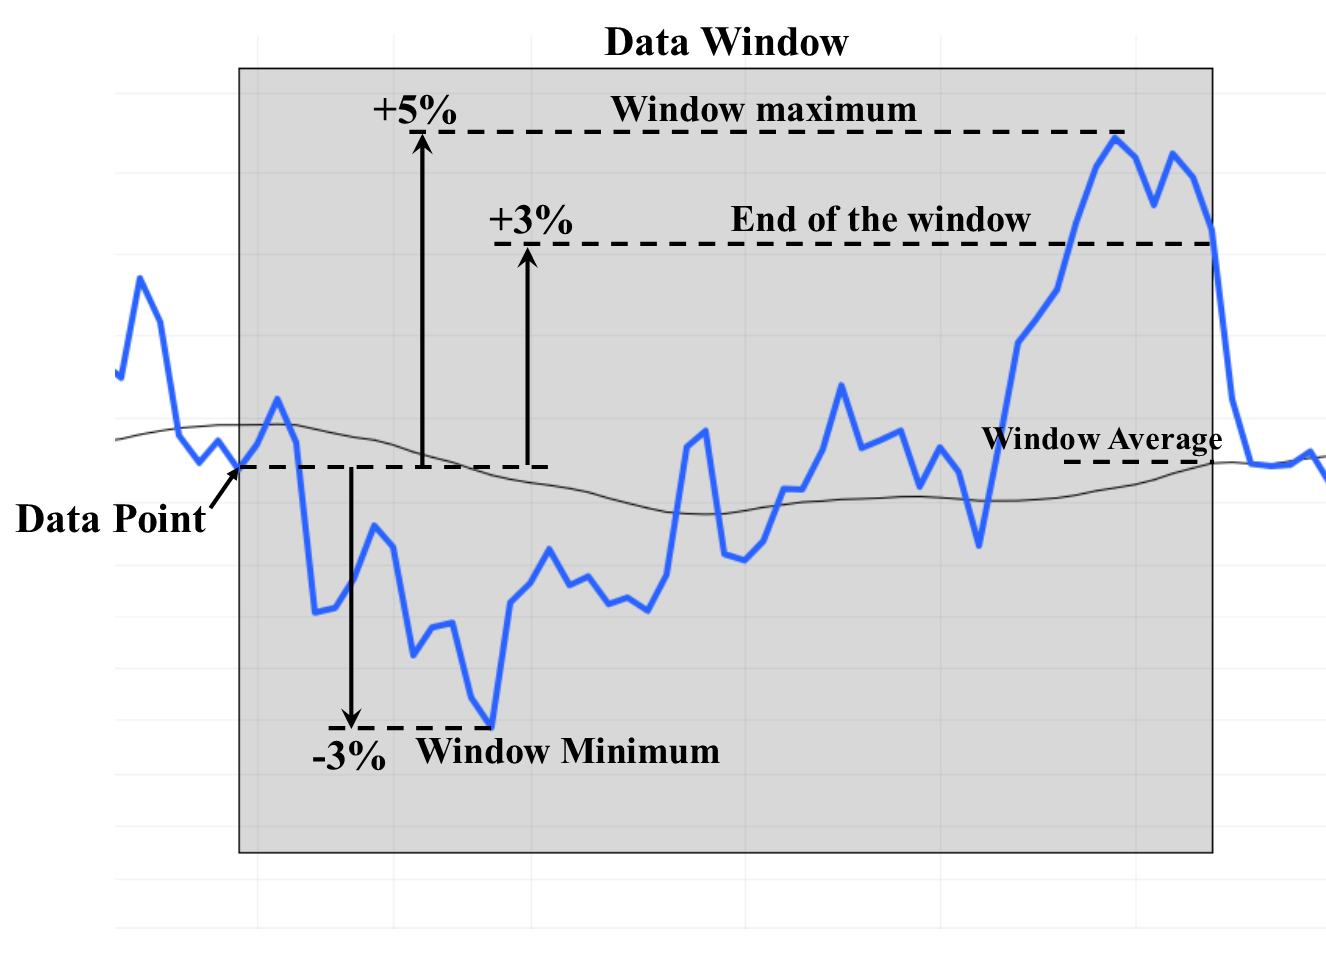
Measurement Method: The metric used to model the price behavior in the window; could be max, min, average, and end of window. When max is used, the maximum run-up in the window is reported as the target value. Using min gives you maximum drawdowns. average and end of window return the average rate of change ( sum of candle rate of changes divided by the number of candles in the window) and the rate of change when only the price of data of the first and last candles in the windows are considered, respectively.
Target Name: The name given to the column that stores the result
The figure below shows the values the target returns in each mode
