What are Targets?
A target is a function that looks into future candles and returns labels or numeric values that help us quantify the future performance of the asset or pair. Since targets use data from future candles, they cannot be used directly in trading. Instead, you can use them to train machine learning models or perform statistical analysis to evaluate your strategies.
We have two types of targets:
Numerical Targets: Targets that assign numeric values to candles
Categorical Targets: Targets that assign labels to candles (usually Buy, Sell, and No-Action)
The QuantiX offers multiple targets allowing you to use different approaches to quantify the future performance of candles. The list of these targets is provided below.
Rally-Based Targets
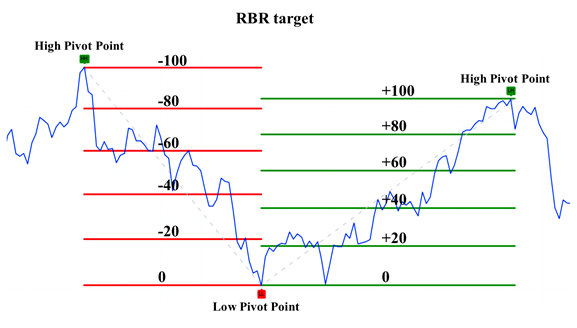
Rally-Based targets quantify the position of candles in rallies. A rally is a price movement connecting high and low pivots in the price. An upward rally is a rally that starts with a low pivot and ends with a high pivot. A downward rally is a rally that begins with a high pivot and ends with a low one. This class of target finds pivots in the price and assigns numeric values or labels to candles based on their relative position concerning the nearest high and low pivots.
Rally-Based Rating
Rally-Based Rating (RBR) assigns a rating (a number between -100 and +100) to data points based on their price position in the market rallies. A market rally refers to the data points that are between a high and low pivot point. A high pivot point marks the end of an upward trend and the beginning of a downward one, where its price is higher than both preceding and subsequent N prices. The inputs of this target are:
Pivot Window Length: The number of candles considered to find pivots in the past and future; smaller values make the target consider shorter-term rallies.
Target Name: The name given to the column that stores the result
When the market is in a downtrend, the RBR value will be negative. The closer it is to the high pivot point of rallies, the more negative the RBR value will be. Conversely, in an upward trend, the RBR value will be positive and will have a higher value as it gets closer to the high pivot point.

Rally-Based Classifying
Rally-Based Classifying (RBC) uses RBR to label candles as b, sell, or no-action. The inputs of this target are:
Pivot Window Length: The window length used to calculate rally-based rating
Buy Threshold: The percentage of rallies closest to a low pivot labeled as buy
Sell Threshold: The percentage of rallies closest to a high pivot labeled as sell
Labels: The labels given to candles that fall in buy, no-action and sell ranges, respectively
Target Name: The name given to the output column
Reward/Risk Targets
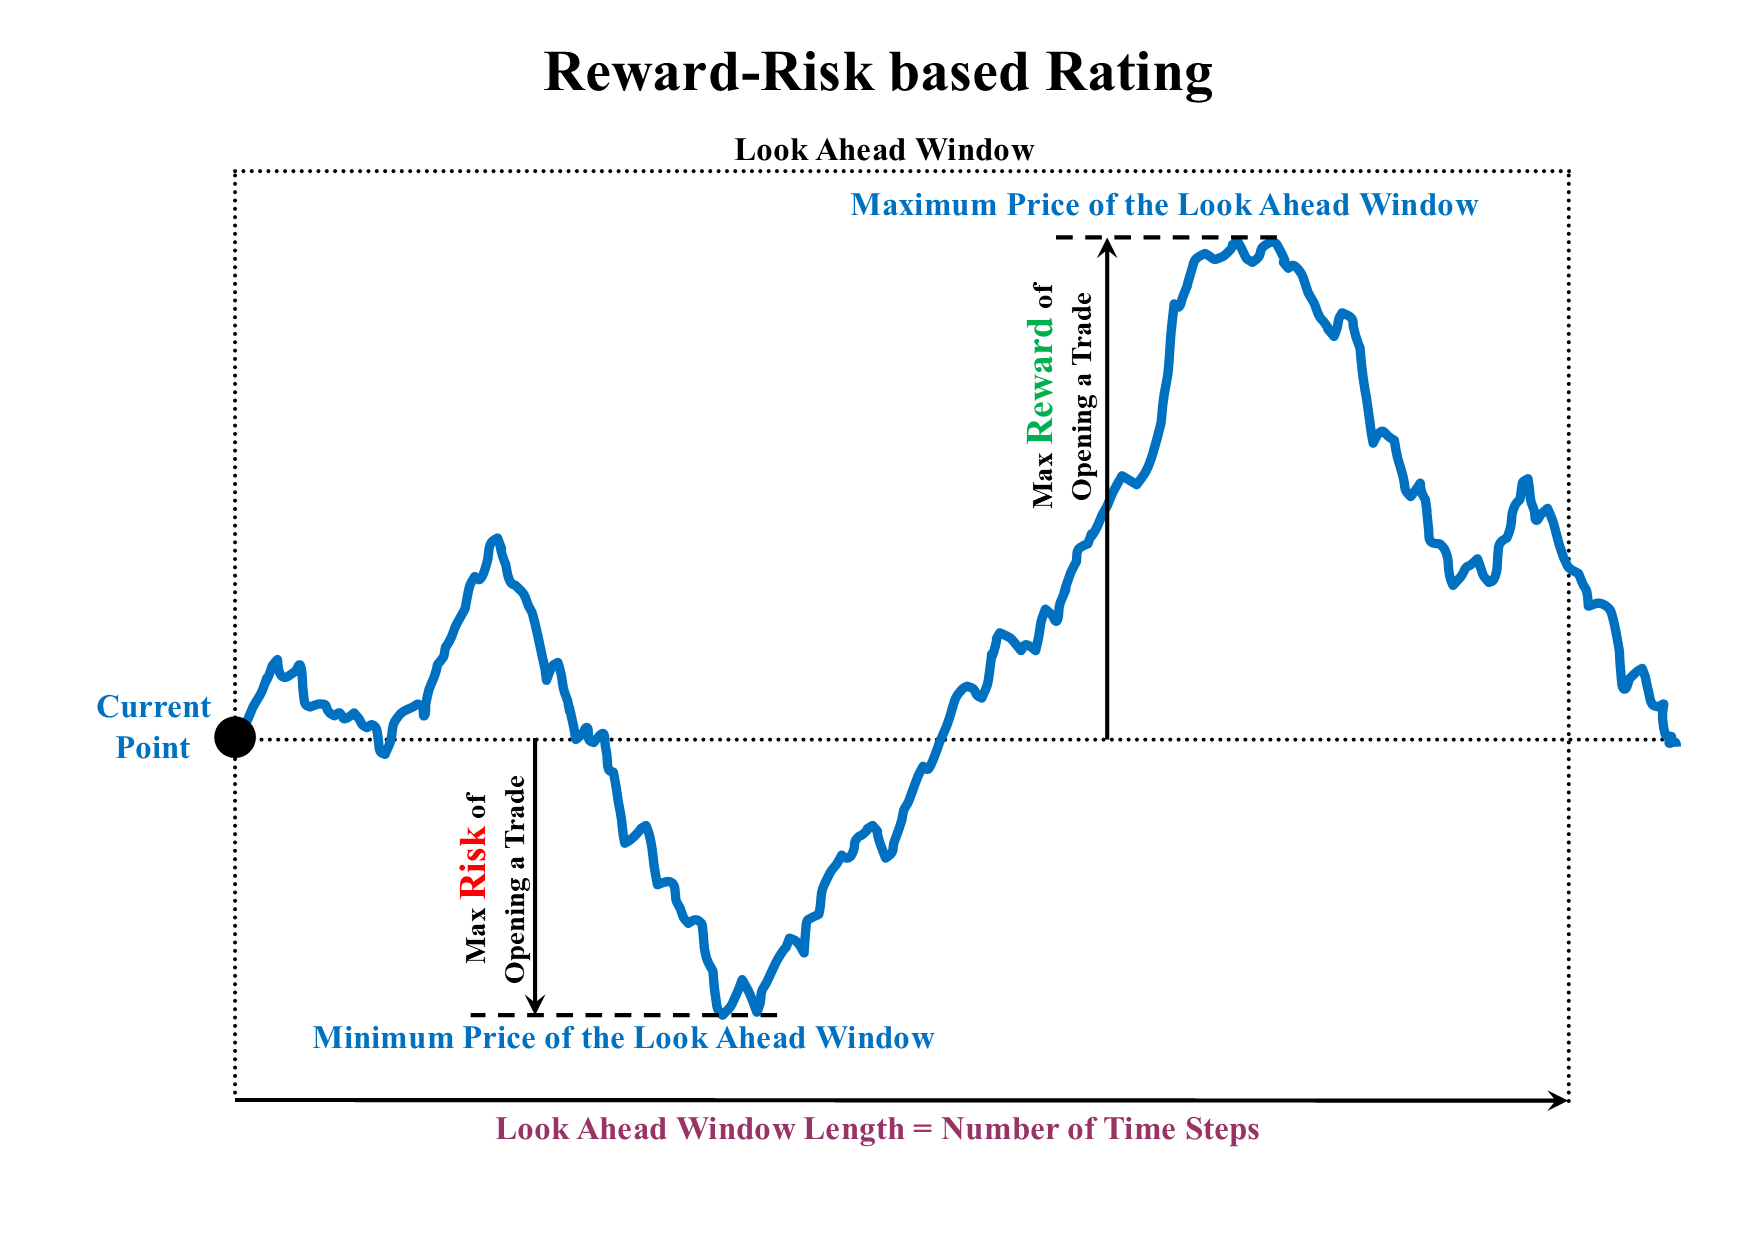
Reward/Risk targets consider N candles in the future and measure the potential reward and risk of opening a position at a candle. We have Reward/Risk Rating and Reward/Risk Classifying that return numeric values and targets, respectively.
Reward/Risk Rating
Reward/Risk Rating measures the maximum run-up and drawdown in the forward-looking window with a defined window size. The reward to risk ratio is defined as (maximum run-up/maximum drawdown). inputs of this target are:
Look Ahead Window Length: The size of the window in which drawdown and run-up are calculated for candles
target Name: The name given to the output column

Reward/Risk Classifying
Reward Risk Classifying measures the maximum rup-up and drawdown in the forward-looking window with a defined window size. The reward and risk are defined as (maximum run-up/maximum drawdown) and (maximum drawdown/maximum run-up), respectively. If the reward or risk exceeds user-defined thresholds, the candle is labeled buy or sell, respectively. The inputs of this target are:
Look Ahead Window Length: The size of the window in which drawdown and run-up are calculated for candles
Risk/Reward Ratio For Sell Label: Sell threshold
Reward/Risk Ratio For Buy Label: Buy threshold
Labels: Labels given to candles
Target Name: The name given to the output column
Gain-Based Rating
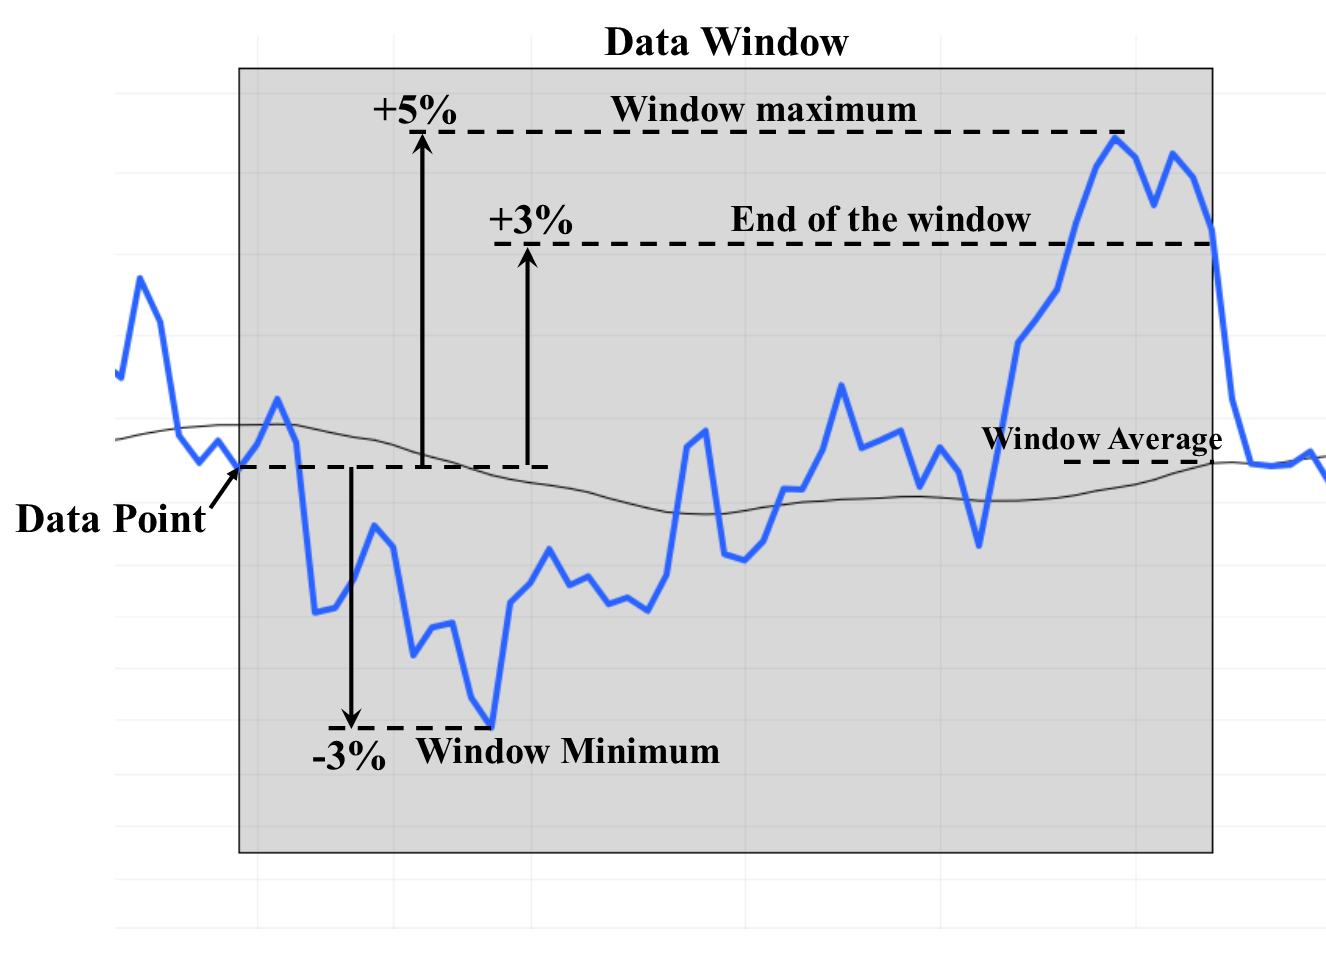
Gain-Based Rating (GBR) checks candles in a forward-looking window and returns window attributes as a rating. These attributes include maximum run-up, maximum drawdown, average price change percentage, and price change percentage at the end of the window. Inputs of this target are:
Look Ahead Window Length: The size of the forward-looking window
Measurement Method: The metric used to model the price behavior in the window; could be max, min, average, and end of window. When max is used, the maximum run-up in the window is reported as the target value. Using min gives you maximum drawdowns. The average and end of window return the average rate of change ( sum of candle rate of changes divided by the number of candles in the window) and the rate of change when only the price of data of the first and last candles in the windows are considered, respectively.
Target Name: The name given to the column that stores the result

Stoploss-Takeprofit Classifying
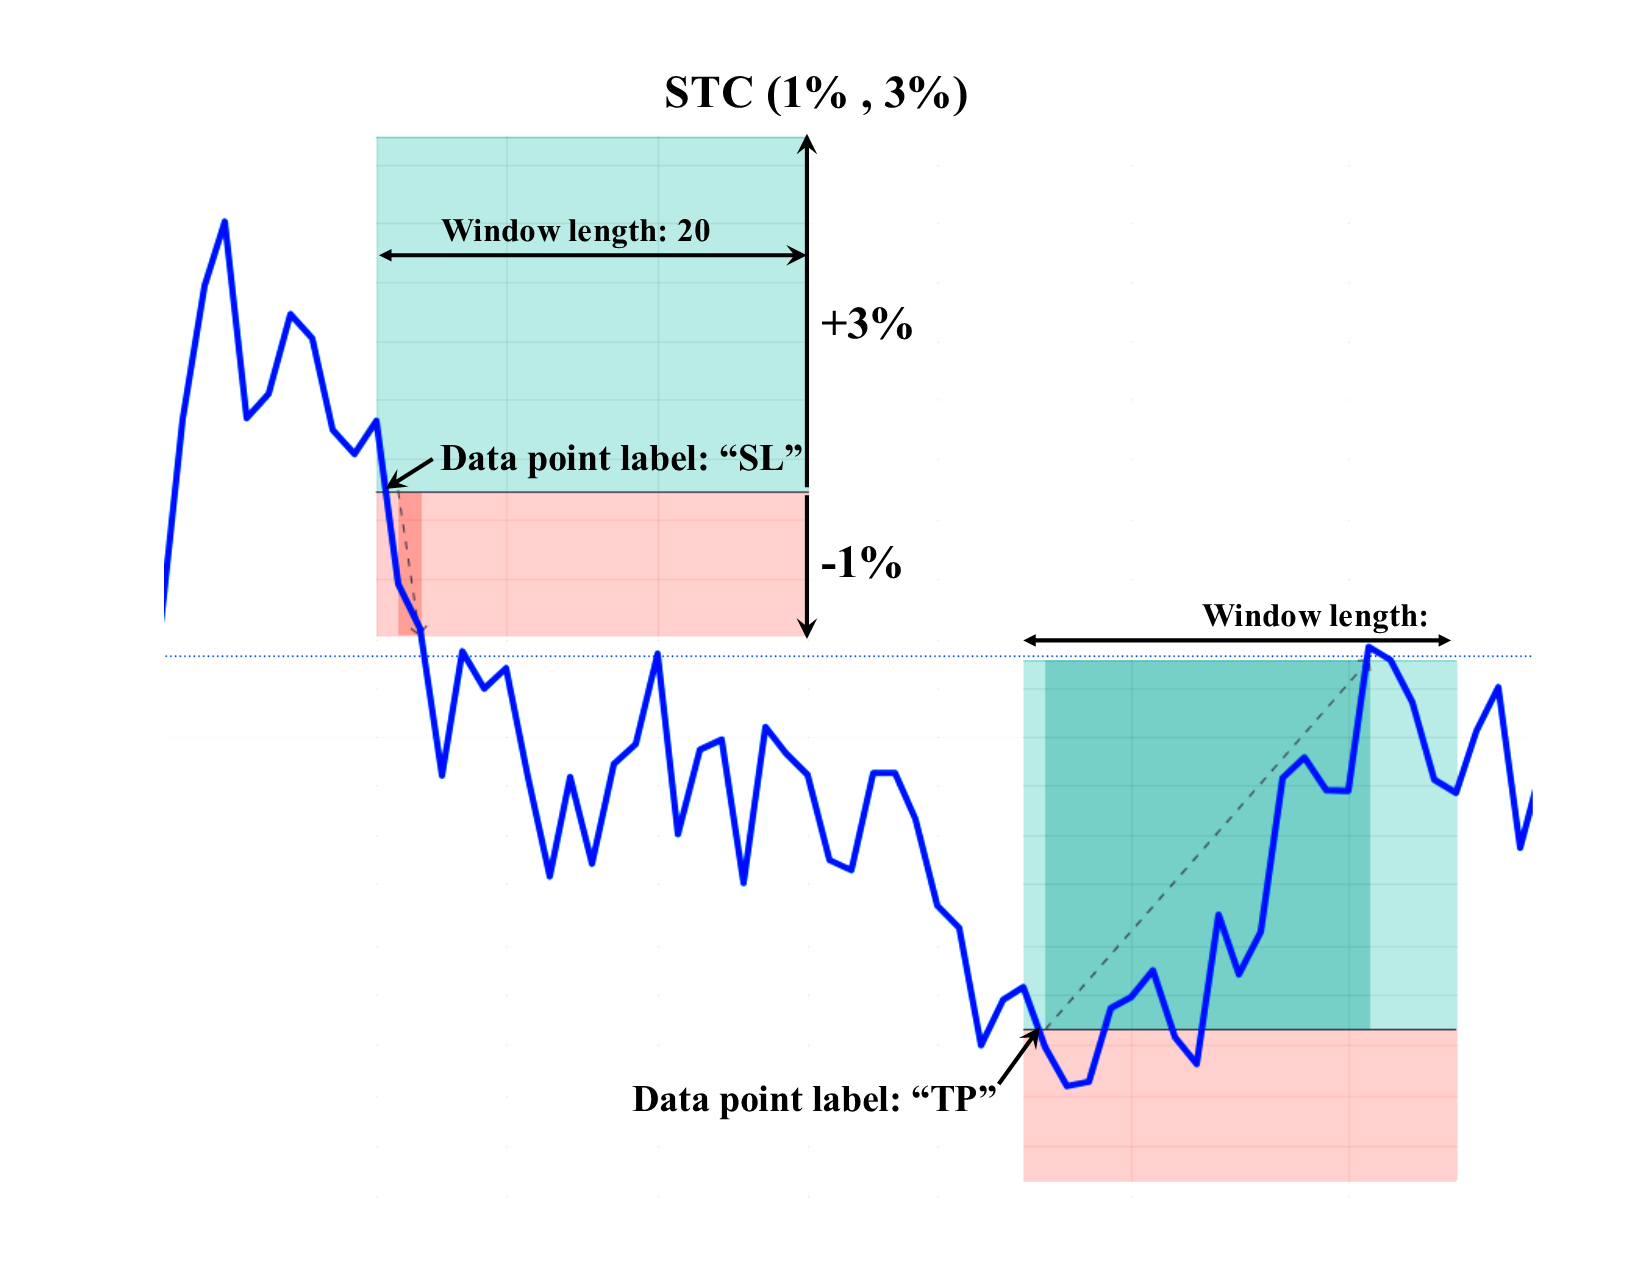
This target labels candles based on future price movements within a time window of a specified length. If the price increases by a percentage defined by Take Profit Percentage, the candle is labeled TP (Take Profit). If the price drops by Stop Loss Percentage percent, the candle is labeled SL (Stop Loss). Any candle that is not TP or SL is labeled NA (No-Action). Note that if both stop loss and take profit orders are hit in a window, the target considers the order reached sooner.
The inputs of this target are:
Look Ahead Window Length: The number of candles considered for hitting take profit or stop loss
Trade Type: Define the trade side that you want to use this target for; it can be Long or Short
Stop Loss Percentage: The stop loss value (in percent)
Take Profit Percentage: The take profit value (in percent)
Labels: Labels given to candles
Target Name: The name given to the output column
The figure below illustrates the target behavior. Using this target with Take Profit Percentage and Stop Loss Percentage values of 3 and 1, respectively, the labels for the first and the second window are SL and TP, respectively.

Positive Momentum Targets
Positive Momentum Rating
Positive draws a horizontal line from the candle to the end of a forward-looking window of size N. It then calculates the area between candles above the line and the line and the area between candles below the line and line. In the figure below, These areas are shown in green and red, respectively. If G is the green area and R is the red area, the Positive Momentum Rating is G/(G+R)
The inputs of this target are:
Look Ahead Window Length: The size of the forward-looking window
Target Name: The name given to the output column

Positive Momentum Classifying
Positive Momentum Classifying uses Positive Momentum Rating to label candles. If the positive momentum rating is greater than a buying threshold the candle is labeled as buy, if it is smaller than a selling threshold, the candle is labeled as sell. Otherwise, it is labeled as no-action. The inputs of this target are:
Look Ahead Window Length: The size of the forward-looking window
Buy Threshold: The minimum value the positive momentum rating should be to label a candle as buy
Sell threshold: The maximum value the positive momentum can be to label a candle as sell
Labels: Labels given to candles
Target Name: The name given to the output column
Trade-Based Rating
This returns attributes of the price before a user-defined exit signal occurs. For each candle. this target defines a window starting at the candle itself and ending at the next exit signal. The target returns the attributs of this window and the price itself based on the Measurment Method selected by the user. These attributes are:
Number of time steps to the next exit signal
Return made by opening a position at candle and closing at next exit signal
Average price before next exit signal
Standard deviation of prices before next exit signal
Max return made by opening a position at candle before next exit signal
Min return made by opening a position at candle before next exit signal
The inputs of this target are:
Timeframe: The timeframe in which the exit signal is defined
Exit Signal: The signal being analyzed
Measurement Method: The attribute of the window or price returned by the target
Target Name: The name given to the output column
Triple Barrier Method
The Triple Barrier Method (TBM) is an adaptation of a labeling technique first introduced in Advances in Financial Machine Learning by M. L. de Prado. This method assigns labels to price candles using three barriers: two horizontal barriers and one vertical barrier.
If the price touches the upper barrier first, the candle is labeled tp, indicating that the price has increased and reached the take-profit level. If the price touches the lower barrier first, the candle is labeled sl, indicating that the price has decreased and reached the stop-loss level. If neither the upper nor the lower barrier is touched before the end of the forward-looking window, the vertical barrier is reached, and the candle is labeled na.
The positions of the upper and lower barriers are calculated dynamically based on the standard deviation of the price’s percentage changes over a backward-looking window. This results in adaptive take-profit and stop-loss levels for each candle, reflecting recent market volatility.
The inputs for this labeling method are:
Backward-Looking Window Size: The number of previous candles used to compute the standard deviation of the price’s percentage changes.
Forward-Looking Window Size: The number of future candles during which the price is monitored to determine whether it hits the upper or lower barrier. If neither barrier is reached, the candle is labeled na.
Take-Profit Coefficient: The upper barrier is defined as
current price + (Take-Profit Coefficient × standard deviation of price percentage changes in the backward-looking window).Stop-Loss Coefficient: The lower barrier is defined as
current price + (Stop-Loss Coefficient × standard deviation of price percentage changes in the backward-looking window).
The figure below illustrates how the target works. The green lines represent the upper barriers across three different windows, while the red lines indicate the corresponding lower barriers. The dashed and solid black lines mark the beginning and end of each window, respectively. Specifically, the dashed line denotes the first candle, and the solid line represents the vertical barrier. The number of candles between these two lines corresponds to the Forward-Looking Window Size.
The positions of the upper and lower barriers depend on the Take-Profit and Stop-Loss coefficients, respectively. Higher values of these coefficients make the barriers harder to reach. Note that the positions of the barriers are determined not only by these coefficients, but also by the standard deviation of the price’s percentage changes over the most recent Backward-Looking Window Size number of candles.
To read more about this method, please refer to Advances in Financial Machine Learning.
