Tutorial 1: Create Market Data
Market data is our solution for storing financial market data. To use any of our services, you need to store the relevant data involved in Market Data. It allows you to store historical price data and technical indicators for any number of assets. The platform can calculate various technical indicators and offers a wide range of tools to process both raw price data and technical indicator data.
To do so, Open, High, Low, Close, and Volume (OHLCV) data of the assets are required. This data can be fetched from different databases.
In the following sections of this tutorial, we will discuss how to create Market Data, add technical indicators to it, and use QuantiX functions to further process this data
How to Create Market Data
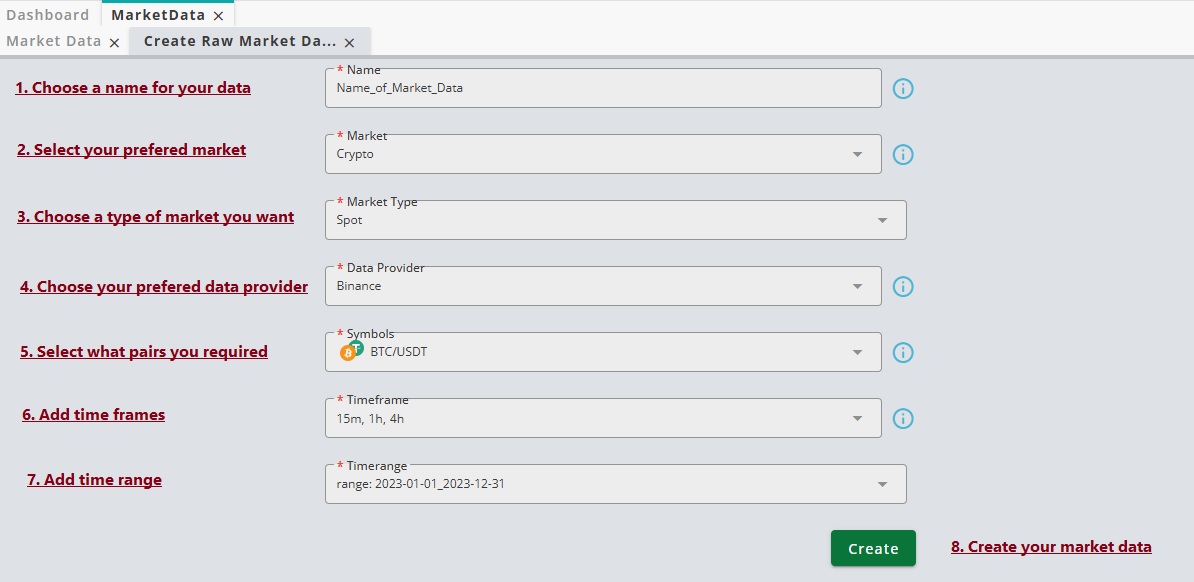
From the left sidebar, select Market Data. After the tab opens, click on Create Raw.
To make a new market data:
Give a name to the data. This name will then be used to refer to this Market Data.

From the Market dropdown box, select the market which the data is going to come from.
After choosing the Market, you should select your required market type. For instance, for Crypto Market, we have Spot and Future:
Then in following section you should choose Data Provider.Available pairs in the database of the data provider are shown in Symbols. Select as many pairs and timeframes.
For adding range of the time, you can either set it manually or use Time range manager. For more information about time range manager read Time Range Management

By clicking on Create, QuantiX connects to the data provider and downloads the OHLCV data of the selected pairs for the given timeframes. Note that it can take sometime if you select many pairs or use high resolution timeframes when the time span of the market data is relatively large.
Note that one can also use Import Market Data option from Market Data menu to upload the price data associated with Forex assets by using .csv files. To read more about this feature,please refer to Import Market Data.
How to Edit Market Data
When a market data is created, it will be opened in a new tab. This tab is always accessible by using Edit option from Actions menu in front of the name of the market data in Market Data Table. 
To see the contents of the market data click on its row. You can either use Grid or Chart:
Grid allows you to read the data of the market data in a table.
Chart draws candlestick charts for the assets in the market data.
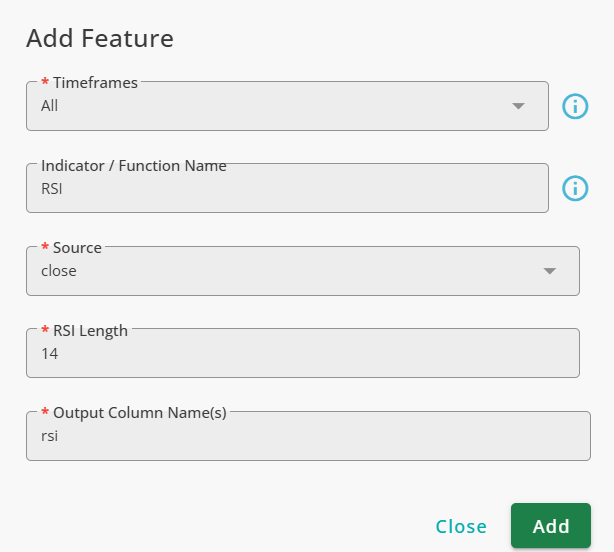
To add a new technical indicator or any other data to the market data, use the Add Feature button. When you click on Add Feature, a new window opens. In this window, you can select various technical indicators, price patterns, candle patterns, etc., to add to your market data.
If the market data includes multiple timeframes, you can also select the timeframes to which the selected feature will be added. By default, the system adds features to all timeframes.
When a technical indicator or any other feature is selected, the related settings are displayed. Configure the settings according to your preferences and click Add.
In the figure below, the RSI indicator with default settings has been added to the market data: 
All added features are shown in a table in the Market Data tab. You can edit the settings of the features or remove them from your market data at any time using the Edit and Delete options in the Actions menu.
The QuantiX Platform offers a wide range of publicly available and exclusive technical indicators, enabling its users to obtain the necessary information for analysis. Below is a list of the technical indicators available in the QuantiX Platform:
Trend Magic: Combines moving averages to identify trends and potential entry or exit points in the market.
Super Trend: Identifies the direction of the current trend and potential entry or exit points in the market.
Bollinger Bands: A popular indicator that dynamically adjusts based on market volatility.
MOM: Measures the rate of change in prices over a specified time period.
OBV: A momentum indicator that uses volume flow to predict changes in stock price.
ATR: A volatility indicator that measures the average range between the high and low prices of an asset over a specified period.
NATR: A variation of the Average True Range (ATR) indicator that standardizes the ATR values on a scale from 0 to 100.
AROON: Identifies the strength of a trend and potential trend reversal points.
EMA: A moving average that emphasizes recent price action more than older data.
SMA: Determines the average price of a security or asset over a specific period by summing up the prices and dividing by the number of periods considered.
DEMA: A responsive moving average that aims to reduce lag by applying double smoothing to price data.
KAMA: A technical indicator that adjusts its sensitivity to market volatility.
TEMA: A technical indicator that aims to reduce lag while maintaining smoother responses to price changes compared to traditional moving averages.
TRIMA: A smoothed moving average that provides a middle ground between simple and exponential moving averages.
WMA: A moving average that assigns different weights to each data point within the specified period.
HMA: A refined moving average that aims to reduce lag while maintaining smoothness.
T3: A moving average that applies multiple smoothing iterations to reduce lag and offer a smoother representation of price movements.
SAR: A trend-following technical indicator designed to determine potential stop-loss points and provide entry and exit signals.
ICHIMUKO: A comprehensive technical analysis tool developed in Japan. It consists of several components that offer a holistic view of support, resistance, trend direction, and momentum.
SWMA: A moving average that assigns different weights to data points within a specified period, but it utilizes symmetrical weights.
MA FIB BAND: A series of bands deviated from a moving average by scaling it with Fibonacci coefficients.
CMF: A commonly used indicator that shows the buying/selling pressure.
Level: A QuantiX exclusive tool that uses previous pivot points to derive the probability that the current point is a pivot (check the pivot function for more details).
Fibonacci: Fibonacci retracement bands.
Normalized Slope: A QuantiX exclusive indicator that measures the price rate of change with respect to recent price changes.
Mean Reversion: A QuantiX exclusive tool that models the mean-reverting behavior of the price toward any kind of moving average.
NVP: Normalized Mean Profit is a QuantiX exclusive set of indicators that try to quantify markets with respect to mean reversion theory.
Pivot: Used to find price pivots. The outputs of this function use future prices.
RSI: A momentum oscillator that measures the speed and change of price movements.
Stochastic: A momentum indicator that compares a security’s closing price to its price range over a specified period.
CCI: A momentum-based oscillator used to identify cyclical trends in financial markets.
MFI: Measures the strength of buying and selling pressure in a stock or asset over a specified period.
CMO: Measures the momentum of a security’s price movements.
MACD: A trend-following momentum indicator that consists of two lines.
WiLLR: A momentum oscillator used to identify overbought or oversold conditions in a market.
StochRSI: Combines elements of both the Stochastic Oscillator and the Relative Strength Index (RSI).
Fisher: Transforms price data into a Gaussian normal distribution.
QuantiX KAMA: A QuantiX exclusive adaptive moving average designed to follow the price volatility better while it still has a good memory of the past.
Candle Patterns: A large number of candle patterns including hammer, hanging man, doji patterns, etc. are available in QuantiX platform.
Price Patterns: Different price pattern detectors including double top, double button, triple tops, triple buttons, head and shoulder, etc. are available.